


Gold Price Forecast: Bearish
- Despite an encouraging start to the New Year Gold bulls are licking their wounds after a nasty second-half of the week.
- Gold prices were riding along trendline support until earlier this morning, at which point bears took over and haven’t yet looked back.
- Bitcoin, on the other hand, remains in the midst of a parabolic-like bullish breakout. Given the risk events from this week, this may beg the question as to whether or not Bitcoin is receiving safe-haven preference over Gold at this point.
- The analysis contained in article relies on price action and chart formations, along with focus on a couple of different bearish engulfing patterns. To learn more about price action or chart patterns, check out our DailyFX Education section.
Gold Prices Build Bearish Engulfing Pattern as Bitcoin Shoots to the Moon
The early part of this week started off encouraging for Gold bulls: The yellow metal continued to push higher, riding a trendline that had built in December as buyers got back on the bid. This brought hope that bulls would be able to continue pushing prices higher, similar to this summer’s price action. But Gold snapped back aggressively on Wednesday before getting pulverized on Friday, leaving a number of question marks around long-term Gold trends. In a perhaps related matter, however, Bitcoin bulls would not calm down as the cryptocurrency put in a +20% move this week.
The net of this week’s price action in Gold was a bearish engulfing pattern, which is often followed with the aim of bearish continuation. This is similar to the formation that showed up on the Daily chart of Gold back in early-August, on the same day that the metal set its current all-time-high. As highlighted in this weekly technical forecast on Gold at the time, the door had started to open to bearish themes. And now – four months later – bulls have still been unable to re-take control of the situation.
To learn more about bearish engulfing patterns, join us in DailyFX Education
Gold Weekly Price Chart: Bearish Engulf

Chart prepared by James Stanley; Gold on Tradingview
Perhaps the biggest challenge presented by Gold given this week’s performance is pertinence to longer-term trends.
Gold has been in varying forms of a bullish cycle since the Fed came into the spotlight for rate policy in Q4 of 2018. In the opening days of that quarter, as the Fed was in the midst of a hiking cycle, FOMC Chair Powell was directly asked where he felt the ‘neutral’ rate was, to which he opined that he thought it was ‘a long way off.’

In fairly short order risk markets had started to roll over: Stocks were falling and risk-off assets were catching a bid. At the rate decision in December of that year, the Fed stuck to their plan and hiked again – but they also cut their expectations for 2019 hikes down to two from a prior four. But – even that seemed wishful thinking, and sure enough, as the door opened into 2019 a chorus call of lower rates from various Fed members eventually helped to bring back the bid on the risk trade. In June, this became official as the Fed started talking up rate cuts v/s hikes and in July, the cutting cycle began again.
After three cuts in 2019 the Fed was hopeful that they’d be able to stand pat for a bit. But 2020 had different plans and rates were yanked back to the floor in March. The bullish cycle in Gold continued through much of this period, save for a near 15% sell-off in mid-March as fear dominated the backdrop. But buyers responded to support at the time, retained control of the trend, and by the time summer rolled around Gold prices were ready to go into another hard bullish trend, which showed up in June and lasted through the August open.
But since then – bulls have been on break with only a few fits and starts. This week was perhaps the most discouraging outlay on the bullish side of Gold, given how clear the bullish trend appeared to begin 2021 before prices began to turn-around on Wednesday.
Gold Weekly Price Chart: Cycles Matter
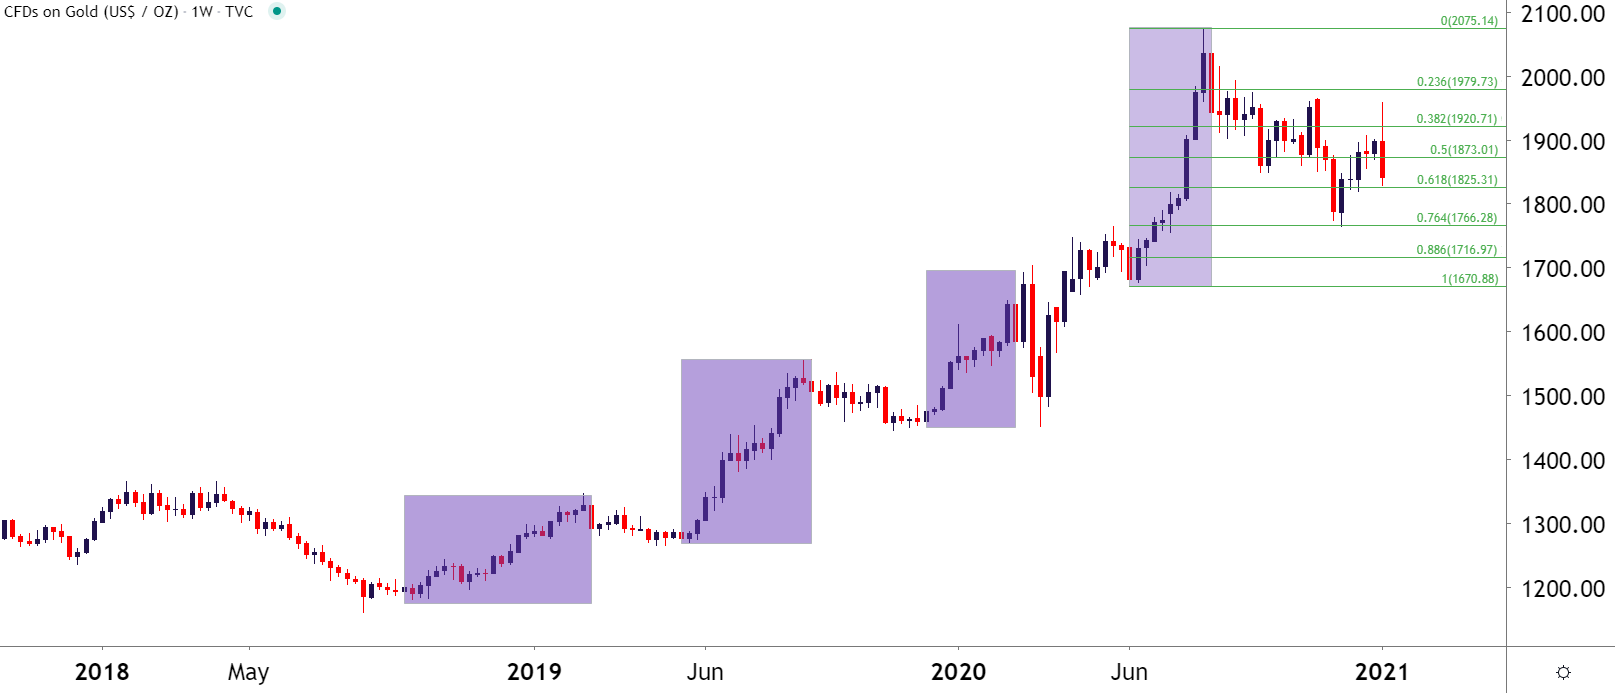
Chart prepared by James Stanley; Gold on Tradingview
Gold Forecast for Next Week: Bearish
The bigger factor here appears to be rates: And the primary factor of importance to this week’s price action appears to emanate from politics, as the Democrat win in Georgia Senate races coincides with the bearish breakdown in Gold prices. That breakdown below support started to show on Wednesday morning, right around the time that it became obvious that both Democrats in Georgia were likely to win.
And given that this only continued to heat up through the rest of the week, as US rates were continuing to rise, it appears as though we’ve isolated a pressure point.
Now – with that being said, it remains unlikely that we’ll see rate hikes out of the Fed anytime soon; but it also appears that with stock markets jumping there’s little motivation for the Fed to talk up stimulus or support. So, we may simply be in a continued holding pattern on that bullish theme until either a) something breaks and the Fed has to get dovish again or b) the globe really starts to turn the corner on covid. The former of those scenarios could bring on higher Gold prices while the latter makes an argument for lower Gold prices.

For now – that bearish trend is there and there could be more room to go. For those looking at bearish scenarios in Gold, there’s an area of prior support that looms large above current price action, and this could be a very interesting area to follow for lower-high resistance. This plots from 1859-1871, and this is the same zone that came into play as support after that bearish engulfing showed on the Daily chart as Gold set its all-time-high in March. This zone has functioned as support numerous times already; so some resistance here could allow for healthy construction of a continued bearish trend.
But - for those that are following risk aversion plays, I go a little deeper into Bitcoin below this Gold chart.
Gold Daily Price Chart

Chart prepared by James Stanley; Gold on Tradingview
Can Bitcoin Wear the Crown?
While Gold struggled this week another market often considered as an ‘anti-Dollar’ prospered quite well, and that’s Bitcoin.
Few could call what took place in Bitcoin this week ‘normal’ for any market. But the cryptocurrency put in a big outing in the first week of 2021 trade; even if it might be difficult to put some of these numbers into scope, such as:
Bitcoin was up as much as 44.82% for the year, one week into 2021 trade.
If that doesn’t amaze, perhaps the next one will:
Bitcoin is up over 130% from the December 11th low. That’s more than doubling in less than a month.
However you cut it, what’s taking place in cryptocurrencies at the moment is outlandish. And as I’d written before, there are definitely qualities that can be attractive for long-term accumulation of cryptocurrencies. But – what we’re seeing here now is a mania; and like all manias, is utterly unpredictable and can last for a long, long time. So, for those that do want to speculate on Bitcoin or cryptocurrencies – fully realize that this volatility can roll both ways, as it did earlier this week when BTCUSD pulled back by 20% before throttling up to a fresh high.
The below chart shows a parabolic like move: But from that move, traders can produce a series of support levels and zones that may be usable in the week ahead as emotions remain high across global markets.
Bitcoin BTC/USD Four-Hour Price Chart
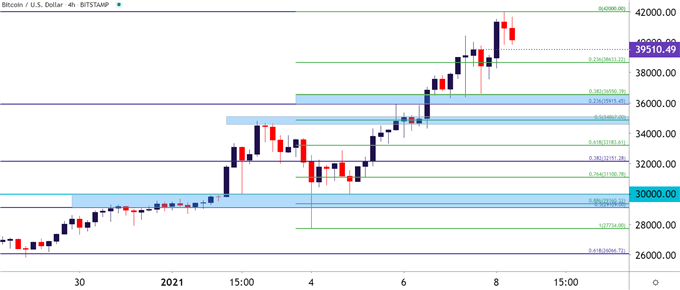
Chart prepared by James Stanley; Bitcoin on Tradingview
--- Written by James Stanley, Strategist for DailyFX.com
Contact and follow James on Twitter: @JStanleyFX


