


Sterling Technical Price Outlook: GBP/USD Weekly Trade Levels
- Sterling technical trade level update – Weekly Chart
- GBP/USD rebound vulnerable while yearly high / multi-year downtrend resistance
- Initial weekly Support 1.3036 –topside breach exposes 1.3675
The British Pound plummeted more than 1.6% againstthe US Dollar this week with GBP/USD posting a massive weekly reversal off fresh yearly highs at multi-year downtrend resistance – this is big. The recent price collapse threatens a larger correction within the confines of the broader Sterling advance in the days ahead. These are the updated targets and invalidation levels that matter on the GBP/USD weekly technical chart. Review my latest Strategy Webinar for an in-depth breakdown of this Cable trade setup and more.
Sterling Price Chart - GBP/USD Weekly
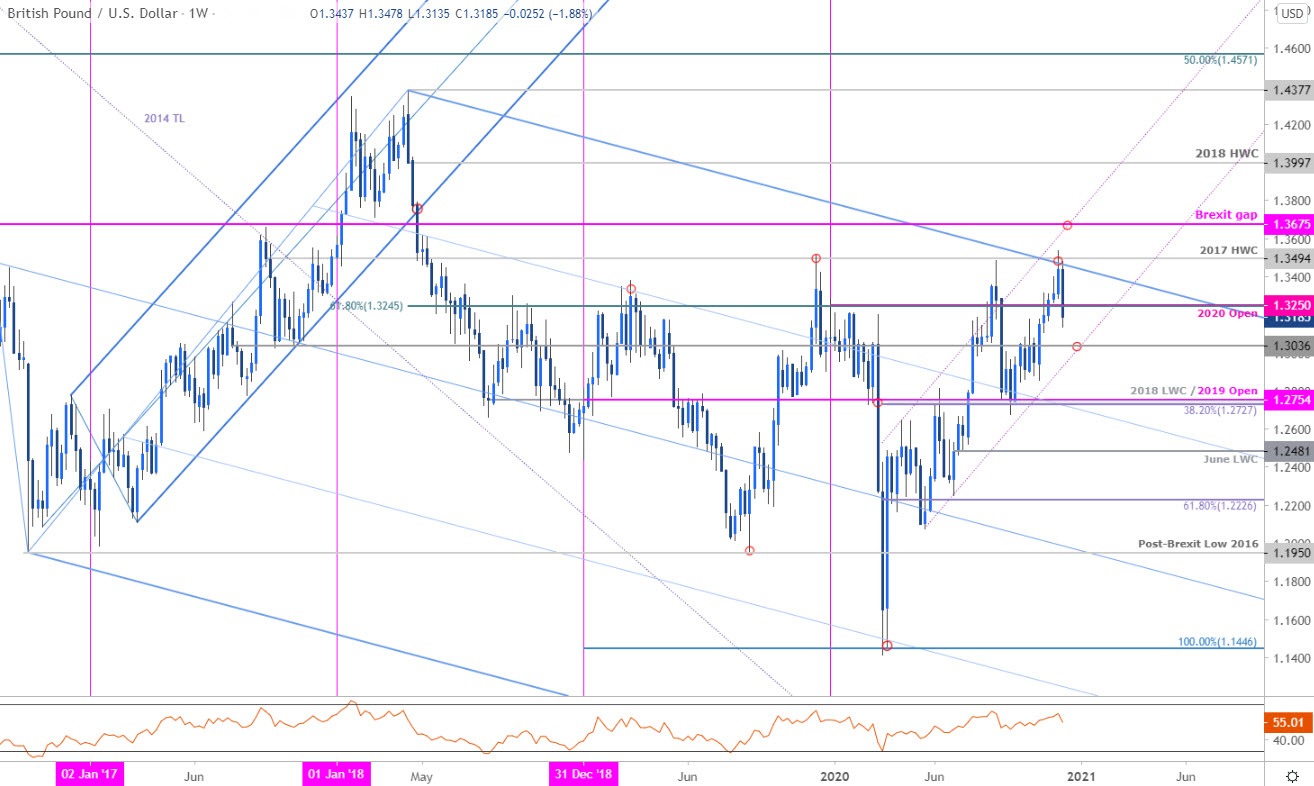
Chart Prepared by Michael Boutros, Technical Strategist; GBP/USD on Tradingview
Notes: In my last Sterling Weekly Price Outlook we noted that the GBP/USD rally was, “approaching broader downtrend resistance near the 2019 / 2020 yearly highs and we’re looking for a reaction early in the month for guidance.” Cable ripped higher into the December open with price registering a high just pips above the 2019/2020 extremes (high registered at 1.3539) before reversing sharply. The broader advance remains vulnerable here while below critical resistance at the upper parallel (blue) / 2017 high-week close at 1.3494 – a breach / close above is needed to validate a larger breakout with such a scenario exposing the 2016 Brexit gap at 1.3675.
We’ve been tracking this pivot zone at the confluence of the 2020 yearly open and the 61.8% Fibonacci retracement of the 2018 decline at 1.3245/50- a close below this region would highlight the threat for a larger correction before resumption of the broader uptrend. Weekly support rests at the May trendline / 1.3036 with broader bullish invalidation at the highlighted confluence zone defined by the 38.2% retracement, 2018 low-week close and the 2019 open at 1.2727/54.
For a complete breakdown of Michael’s trading strategy, review his Foundations of Technical Analysis series on Building a Trading Strategy
Bottom Line: The Sterling rally failed at multi-year downtrend resistance / fresh multi-year highs and leaves the Cable advance vulnerable while below the yearly high- watch the close of the week with respect to 1.3250. From a trading standpoint, be on the lookout for a reaction on a move lower towards uptrend support for guidance – ultimately, losses should be limited to the 1.30-handle IF Cable is indeed heading higher on this stretch. Stay nimble into the close of the week with more Brexit headlines likely to fuel volatility into the Sunday open. Review my latest Sterling Price Outlook for a closer look at the near-term GBP/USD technical trade levels.

Sterling Trader Sentiment - GBP/USD Price Chart

- A summary of IG Client Sentiment shows traders are net-short GBP/USD - the ratio stands at -1.40 (41.63% of traders are long) – weak bullish reading
- Long positions are9.04% lower than yesterday and 14.31% higher from last week
- Short positions are1.20% lower than yesterday and 8.39% lower from last week
- We typically take a contrarian view to crowd sentiment, and the fact traders are net-short suggests GBP/USD prices may continue to rise. Yet traders are more net-short than yesterday but less net-short from last week and the combination of current positioning and recent changes gives us a further mixed GBP/USD trading bias from a sentiment standpoint.
| Change in | Longs | Shorts | OI |
| Daily | 3% | -7% | -3% |
| Weekly | 4% | -10% | -5% |
---
UK / US Economic Data Releases

Economic Calendar - latest economic developments and upcoming event risk.
Previous Weekly Technical Charts
- US Dollar Index (DXY)
- Gold (XAU/USD)
- Euro (EUR/USD)
- Australian Dollar (AUD/USD)
- Canadian Dollar (USD/CAD)

--- Written by Michael Boutros, Technical Currency Strategist with DailyFX
Follow Michael on Twitter @MBForex


