


Sterling Technical Price Outlook: GBP/USD Weekly Trade Levels
- Sterling technical trade level update – Weekly Chart
- GBP/USD breakout approaching resistance at 2019 / 2020 highs
- Critical resistance 1.3494– Weekly support 1.3250
The British Pound is attempting to mark a fifth consecutive weekly advance against the US Dollar into the open of December trade with GBP/USD up than 0.8% ahead of the New York close on Tuesday. A rally of more than 6% off the September lows takes price towards a critical resistance zone near multi-year downtrend extremes – we’re looking for price inflection here early in the month with the immediate advance vulnerable on a push into this key threshold. These are the updated targets and invalidation levels that matter on the GBP/USD weekly technical chart. Review my latest Strategy Webinar for an in-depth breakdown of this Cable technical setup and more.
Sterling Price Chart - GBP/USD Weekly

Chart Prepared by Michael Boutros, Technical Strategist; GBP/USD on Tradingview
Notes: In last month’s Sterling Weekly Price Outlook we noted to, “be on the lookout for possible topside exhaustion into 1.3250 with the broader advance vulnerable while below.” GBP/USD broke & closed above this key zone one week later before resuming higher with the advance now approaching the next major lateral resistance pivot at the 2017 high-week reversal close at 1.3494. Note that the upper parallel of the multi-year descending pitchfork formation rests just below this threshold – we’re looking for a reaction up here.
A weekly close above 1.3494 would be needed to validate a breakout of multi-year downtrend resistance with such a scenario exposing 1.3675 and the 2018 high-week close at 1.3997. Initial weekly support now rests at the yearly open / 61.8% Fibonacci retracement at 1.3245/50 backed by the May trendline / channel support, currently ~1.2950s. Ultimately a close below confluence support at 1.2693-1.2754 would be needed to mark resumption of the broader 2018 downtrend.
For a complete breakdown of Michael’s trading strategy, review his Foundations of Technical Analysis series on Building a Trading Strategy
Bottom Line: The Sterling rally is approaching broader downtrend resistance near the 2019 / 2020 yearly highs and we’re looking for a reaction early in the month for guidance. From a trading standpoint, look to reduce long-exposure / raise protective stops on a probe higher here with a weekly close above 1.3194 needed to suggest a larger breakout is underway. Pullbacks should be limited to the yearly open at 1.3250 IF price is indeed heading higher. Review my latest Sterling Price Outlook for a closer look at the near-term GBP/USD technical trade levels.

Sterling Trader Sentiment - GBP/USD Price Chart
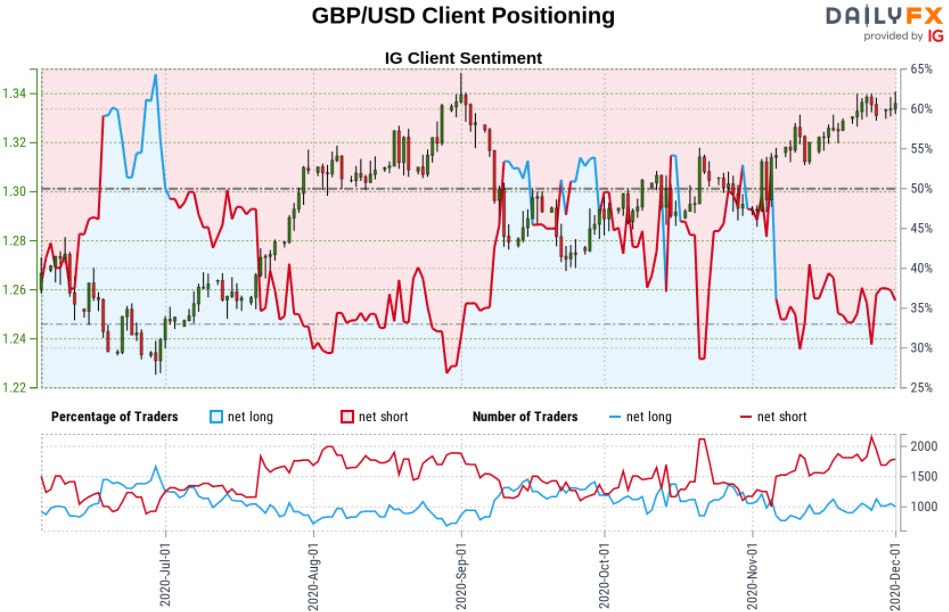
- A summary of IG Client Sentiment shows traders are net-short GBP/USD - the ratio stands at -1.42 (41.36% of traders are long) – weak bullish reading
- Long positions are16.54% higher than yesterday and 12.56% higher from last week
- Short positions are11.34% lower than yesterday and 4.74% lower from last week
- We typically take a contrarian view to crowd sentiment, and the fact traders are net-short suggests GBP/USD prices may continue to rise. Yet traders are less net-short than yesterday and compared with last week. Recent changes in sentiment warn that the current GBP/USD price trend may soon reverse lower despite the fact traders remain net-short.
| Change in | Longs | Shorts | OI |
| Daily | 3% | -7% | -3% |
| Weekly | 4% | -10% | -5% |
---
Key UK / US Data Releases

Economic Calendar - latest economic developments and upcoming event risk.
Previous Weekly Technical Charts

--- Written by Michael Boutros, Technical Currency Strategist with DailyFX
Follow Michael on Twitter @MBForex


