


Euro Technical Forecast, EUR/USD, EUR/GBP, EUR/JPY, EUR/NZD - Talking Points
- Euro technical outlook seems slightly bullish against its major peers
- EUR/USD, EUR/GBP and EUR/NZD saw key breakouts to the upside
- EUR/JPY eyeing ‘Golden Cross’, but prices need to breach resistance
EUR/USD Outlook – Slightly Bullish
Not only did the Euro set new 2020 highs against the US Dollar, but EUR/USD pushed to its highest since the end of April 2018 this past week. The pair took out the key 1.1932 – 1.2011 resistance zone, exposing the midpoint of the Fibonacci extension at 1.2290. Underpinning the pair’s progress has been a bullish ‘Golden Cross’ that formed when the short-term 20-day Simple Moving Average (SMA) crossed above the medium-term 50-day one back in November. However, a Shooting Star candlestick seems to have formed on Friday, a sign of indecision. Should prices turn lower ahead, these may act as key support.

EUR/USD Daily Chart
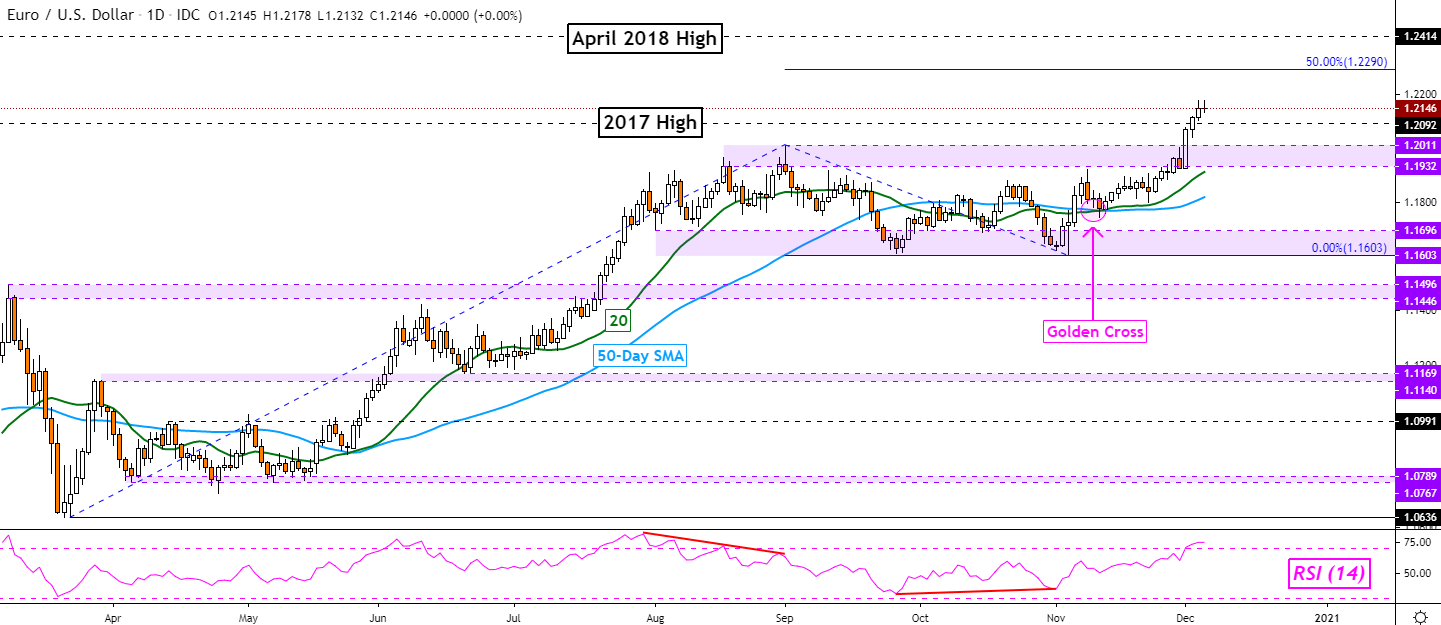
EUR/USD Chart Created in TradingView
EUR/GBP Outlook – Slightly Bullish
The Euro could be on the verge of extending gains against the British Pound after EUR/GBP closed above falling resistance from September. This follows positive RSI divergence, a sign of fading downside momentum. However, confirmation of the breakout has been somewhat lackluster, especially as prices hover around the 50-day SMA. I would like to see a push above the 38.2% Fibonacci extension at 0.9098 to bolster the case to the upside. Key support sits below as the 0.8881 – 0.8861 range.
*Note for GBP traders, Sterling can be quite sensitive to Brexit news flow as policymakers try to come to an agreement before year-end

EUR/GBP Daily Chart
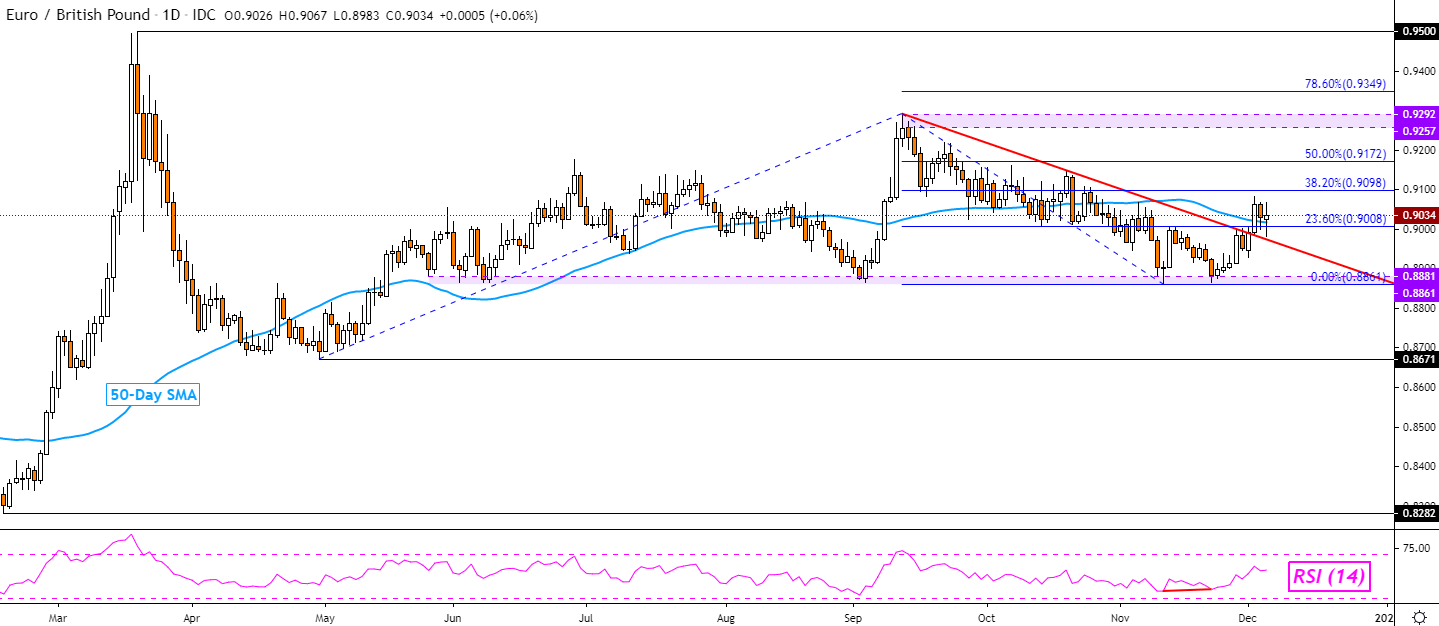
EUR/GBP Chart Created in TradingView
EUR/JPY Outlook - Neutral
The Euro extended gains against the Japanese Yen, but EUR/JPY stopped short of surpassing highs from August around 126.76. As such, this leaves a risk of a turn lower should resistance hold ahead. But, an argument to the upside is that a bullish ‘Golden Cross’ recently formed, alluding to the potential for more gains. If prices rise, keep an eye on the 2019 high at 127.50. Clearing the latter exposes the 61.8% Fibonacci extension at 129.44. Otherwise, a turn lower places the focus on the 20-day and 50-day SMAs.
| Change in | Longs | Shorts | OI |
| Daily | -9% | 0% | -3% |
| Weekly | 17% | -22% | -11% |
EUR/JPY Daily Chart

EUR/JPY Chart Created in TradingView
EUR/NZD Outlook - Bullish
The Euro could be readying to extend gains against the New Zealand Dollar after EUR/NZD confirmed a break above short-term falling resistance from October. This follows positive RSI divergence, a sign of fading downside momentum. As such, we may see a push towards the 50-day SMA and 1.7471 inflection point. Taking these out opens the door to perhaps revisiting the October high at 1.8021. Otherwise, downtrend resumption entails falling under 1.6949 towards the December 2019 low.
For more updates on the Euro and financial markets, follow me on Twitter here @ddubrovskyFX
EUR/NZD Daily Chart
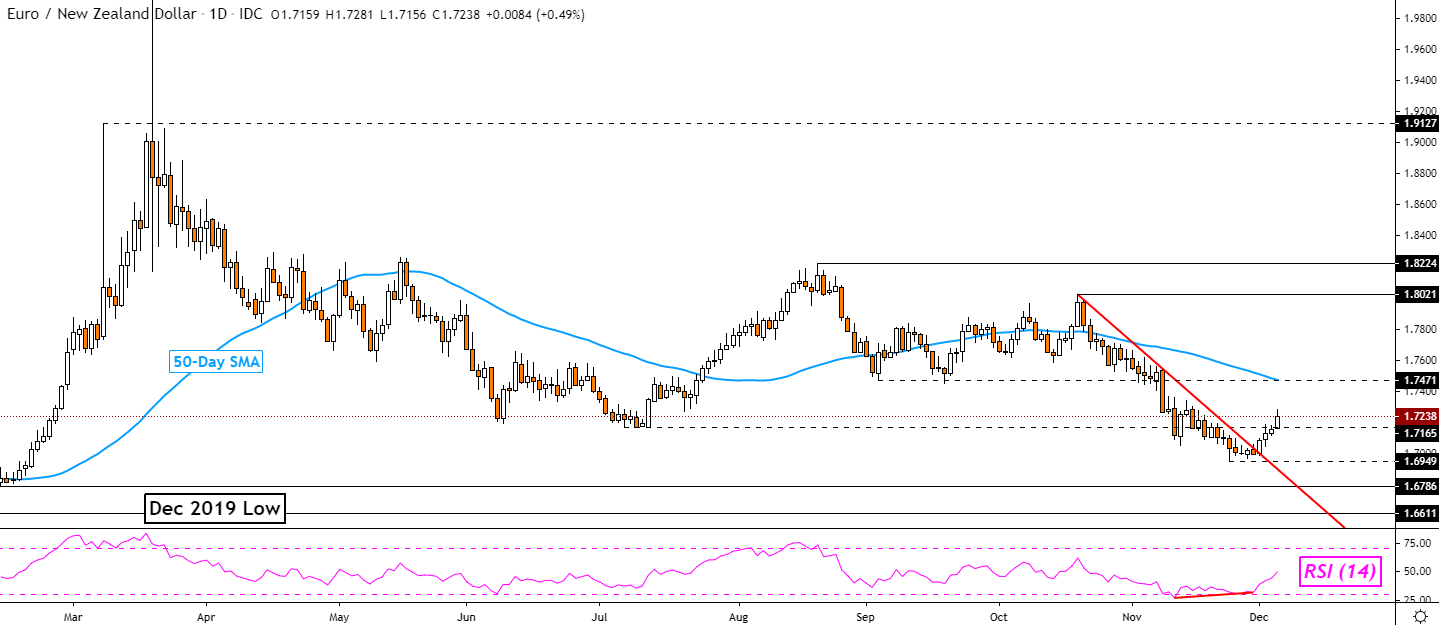
EUR/NZD Chart Created in TradingView
--- Written by Daniel Dubrovsky, Currency Analyst for DailyFX.com
To contact Daniel, use the comments section below or @ddubrovskyFX on Twitter


