US Dollar Talking Points:
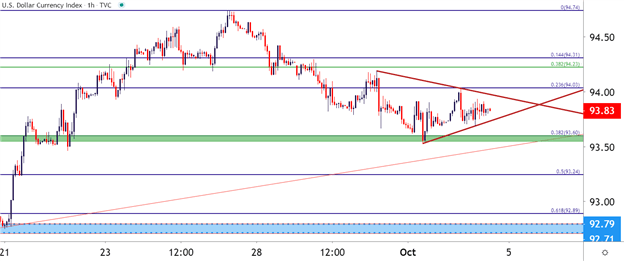
- After a jump last week, the US Dollar settled down, spending the latter-half of this week building into a symmetrical wedge pattern.
- Can USD bulls continue to push? After a fairly bearish outlay since March, the door may be opening for reversal themes in the Greenback, as looked at in the Q4 technical forecast.
- The analysis contained in article relies on price action and chart formations. To learn more about price action or chart patterns, check out our DailyFX Education section.
It was a really busy week on the headlines and, at least initially, in the US Dollar. The latter portion of the week was like at least a little bit of a letdown, as the US Dollar spent the back-half of the week narrowing into a symmetrical wedge formation.
US Dollar Hourly Price Chart

Chart prepared by James Stanley; USD, DXY on Tradingview
Taking a step back, the big item around the Greenback this week was bulls taking a backseat after last week’s fresh two-month-highs.
As looked at coming into September, the US Dollar ran into a big spot of long-term, confluent support. That area helped to reverse the trend, at least for the first few weeks of September; and buyers pulled back as this week opened. That pullback took on a bit more pressure as sellers jumped with a bit more aggression on Tuesday, and that bearish theme lasted through early-Wednesday trade, as well.
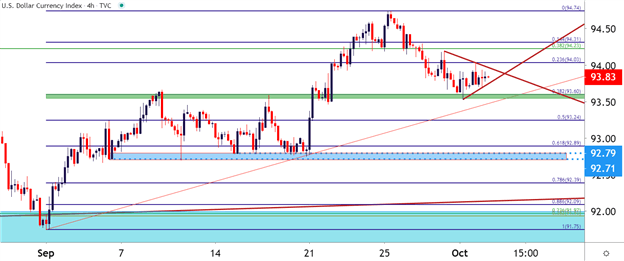
But, as looked at on Wednesday , the US Dollar found support at a key spot on the chart, taken from around the 93.60 level on DXY. That price helped to hold the lows and that’s when this course of digestion began to set-hold.
US Dollar Four-Hour Chart

Chart prepared by James Stanley; USD, DXY on Tradingview
US Dollar Bigger-Picture
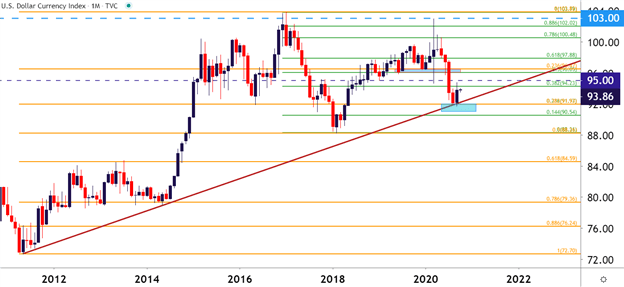
So, 2020… it’s been a pretty crazy year, and we’re still not even 80% of the way through it. But the US Dollar has been along for the ride, initially jumping-higher as the virus was getting priced-in; and then reversing all of that move and then some as calm was restored (at least in markets).
That big picture support that came into play on the first day of September was also the third and final zone of support looked at in the Q3 technical forecast. For Q4, I took a look at the other direction as a number of risks have stacked up; and the technical backdrop appears open for as such. The near-term look contributes little at this point, and for that bullish theme to continue showing promise, a hold of support around the 93.60 level that came into play this week can keep that door open. For invalidation – the subordinated support around the 92.71-92.79 area could function in this regard.
To get access to the Q4 technical forecast for the US Dollar, the link below will help to get that all set up.


US Dollar Monthly Chart

Chart prepared by James Stanley; USD, DXY on Tradingview
--- Written by James Stanley, Strategist for DailyFX.com
Contact and follow James on Twitter: @JStanleyFX


