


Nasdaq 100, DAX 30, FTSE 100, CAC 40 Technical Forecasts: Bearish
- The Nasdaq 100 has developed a descending channel that might guide price lower
- The DAX 30 broke though multiple layers of support, opening the door for extended declines
- The FTSE 100 and CAC 40 trade near the lower end of their longstanding ranges
Nasdaq 100 Technical Forecast
Outlook: Bearish
Market volatility continued last week sending equity markets, growth-sensitive currencies and even some safe haven assets like gold lower. Amidst the equity volatility, bearish price action established several key technical breaks that might leave some indices vulnerable to further losses. Since the tech-heavy Nasdaq 100 has been the leader of global equities in recent months, a newly developed descending channel might be the paramount concern in the week ahead.
Nasdaq 100 Price Chart: 1 – Hour Time Frame (August 2020 – September 2020)

After leading the covid recovery rally, the Nasdaq 100 has undergone somewhat of a reversal as it falls faster and farther than some of its peers. As a result, the index has established a descending channel from the series of recent swing-highs and swing-lows and its formation may help guide the Nasdaq 100 lower still. Thus, support around the 10,680 and 10,600 levels might be crucial in warding off further losses next week.
How does the Stock Market Affect the Economy? A Trader’s Guide
That being said, there have been glimmers of hope for the Nasdaq as the descent has been a slow churn lower rather that an abrupt crash. Following the significant rally on Friday, the Nasdaq 100 trades near the topside of its descending channel headed into this week.
If bulls are to continue the rally, initial resistance might be offered by the September 23 peak at 11,240 which aligns with the upper bound of the channel. A break above the area could lead to further gains but the shorter-term trend seems tilted to the downside at this time.
DAX 30 Technical Forecast
Outlook: Bearish
The DAX 30 suffered a substantial technical breakdown last Monday as it sank beneath an ascending trendline that helped guide it higher since June. With support in the rearview, subsequent losses came readily and secondary support around the Fibonacci level at 12,450 was quickly probed. Price has since recovered from a trip beneath the level, but damage to the technical structure has been dealt and the DAX 30 is vulnerable to further losses as a result.
DAX 30 Price Chart: 4 – Hour Time Frame (June 2020 – September 2020)

With that in mind, tertiary support in the event of renewed bearishness might reside at the 12,200 mark. Coinciding with the index’s July low, a break beneath the area would constitute a new lower-low and would likely weaken the DAX 30 further. Either way, IG client sentiment data reveals retail traders are confident the index has bottomed. Since we typically take a contrarian view to crowd sentiment, positioning could suggest an extension lower.
FTSE 100 Technical Forecast
Outlook: Bearish
Not to be outdone, the FTSE 100 also suffered a breakdown and looks susceptible to further losses as a consequence. Continuing its gradual descent, the FTSE 100 stands near the lower-bound of its descending channel after threatening the level late last week.
FTSE 100 Price Chart: 4 – Hour Time Frame (April 2020 – September 2020)

Since there is little to suggest an immediate reversal higher, the technical outlook remains bearish. That said, short-term gains may shift the risk-reward profile which is currently underwhelming given the proximity to major support. If broken, secondary and tertiary support might reside at 5,680 and 5,500 respectively.
CAC 40 Technical Forecast
Outlook: Neutral
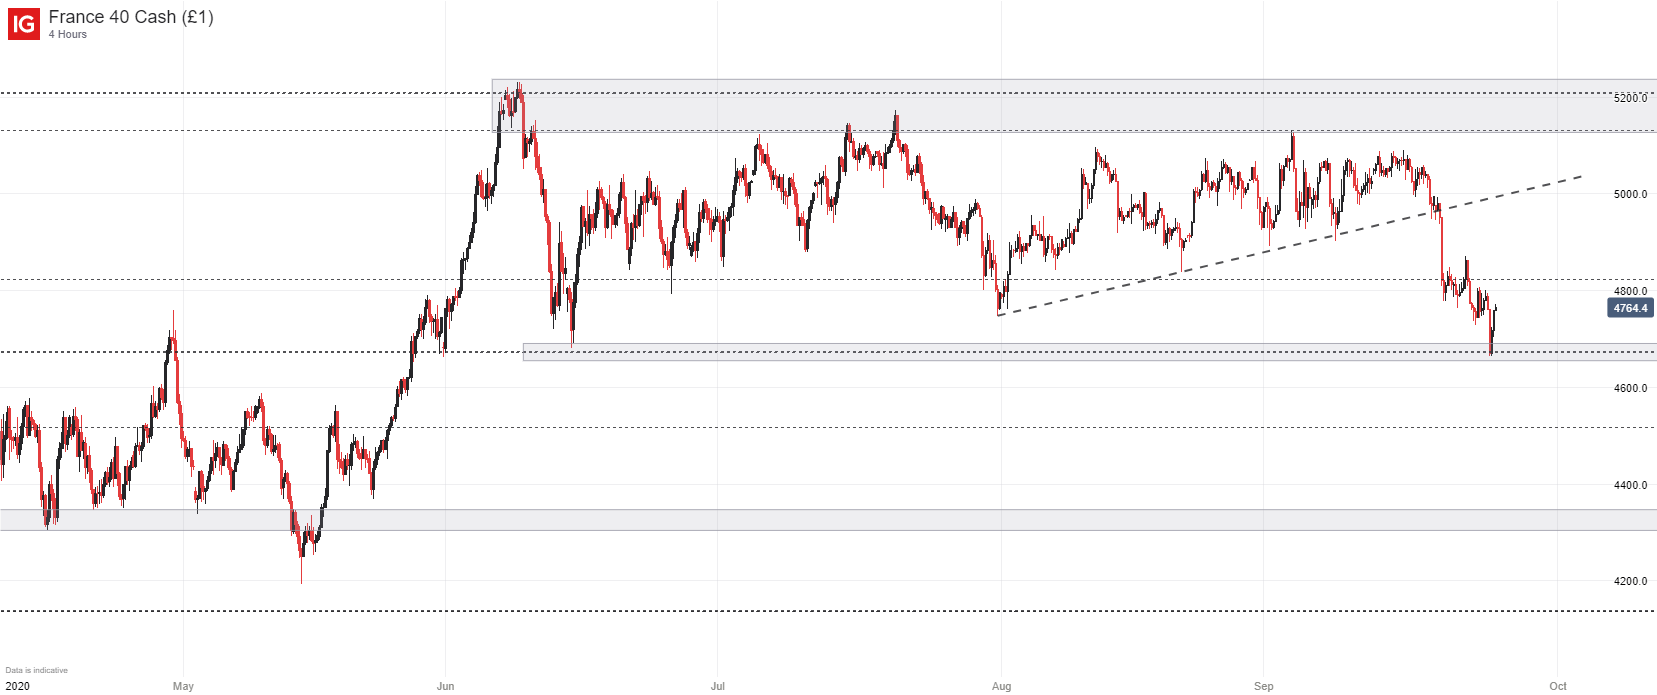
The CAC 40 appears similarly endangered after cratering to Fibonacci support around 4,670 last week. While the breakdown has damaged the technical outlook, the current position of the index relative to support might warrant patience from a trading perspective. In the meantime, follow @PeterHanksFX on Twitter for more forecasts, updates and general market commentary.
CAC 40 Price Chart: 4 – Hour Time Frame (April 2020 – September 2020)
--Written by Peter Hanks, Strategist for DailyFX.com


