


GOLD PRICE TECHNICAL FORECAST: BULLISH
- Gold price edged slightly higher last week but failed to take out the 31 August close
- XAU/USD could extend its advance as bulls defend the 50-day moving average
- The precious metal might struggle if liquidity conditions deteriorate materially
Gold prices gained ground by about 0.7% last week in the wake of the September FOMC decision. XAU/USD traded favorably into the risk event, but as Fed Chair Powell talked down markets and sparked a bid beneath the US Dollar, the precious metal failed to take out last month’s closing level near the $1,980-price mark.

Rejecting this zone of technical confluence reemphasized the symmetrical triangle chart pattern as gold price action consolidates further between its series of higher lows and lower highs. Nevertheless, we are still on the lookout for a potential bullish breakout from this consolidation. Breakout potential could grow more likely as the Bollinger Band width starts to expand, but there is a chance that the looming breakout occurs to the downside.
GOLD PRICE CHART: DAILY TIME FRAME (28 APR TO 18 SEP 2020)
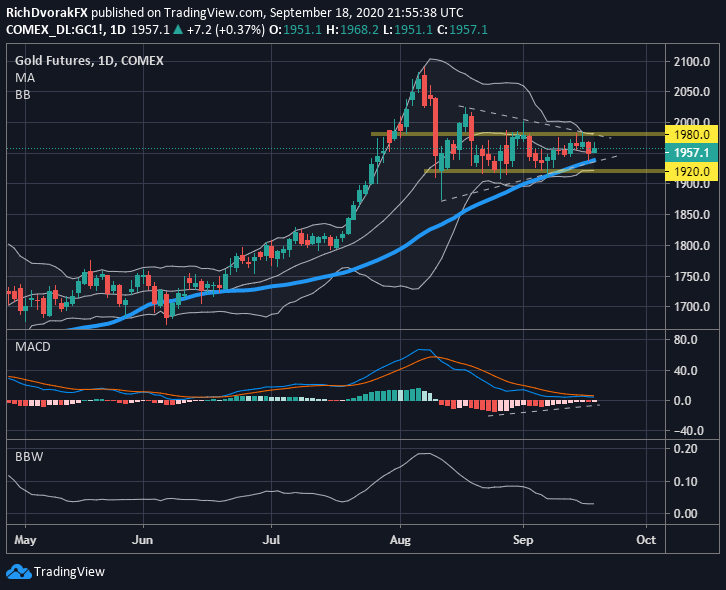
Chart created by @RichDvorakFX with TradingView
This bearish gold scenario could occur if the US Dollar strengthens sharply or resurgent market volatility sours liquidity conditions materially. That said, technical support underpinned by month-to-date lows at the $1,920-price level might provide a formidable layer of defense if sellers attempt to make a push. Gold continues to enjoy buoyancy provided by its positively sloped 50-day simple moving average as well.
| Change in | Longs | Shorts | OI |
| Daily | 1% | -3% | -1% |
| Weekly | 2% | -8% | -2% |
Also worth mentioning, the MACD indicator reveals that key exponential moving averages keep converging higher on balance, and a crossover into positive territory might signal that gold price action is on the cusp of its next leg higher. Topping the 16 September intraday high could encourage gold bulls to set their sights on the $2,010-price zone before all-time highs come back into consideration.
Keep Reading - S&P 500 Price Analysis: VIX Flops as Stocks Hold Weekly Lows
-- Written by Rich Dvorak, Analyst for DailyFX.com
Connect with @RichDvorakFX on Twitter for real-time market insight


