GOLD PRICE FORECAST: PRECIOUS METALS HINGE ON SEPTEMBER FED MEETING
- Gold price edges higher to start the week with the Fed meeting on deck
- XAU/USD gaining ground as the US Dollar weakens and yields retreat
- Precious metals like gold could fall if FOMC officials talk down markets
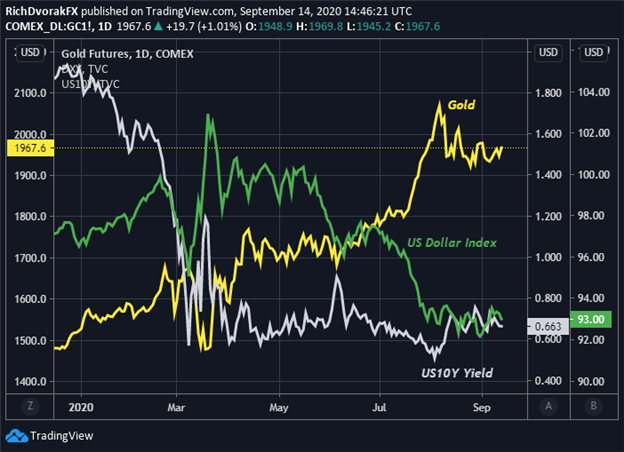
Gold is trading on its front foot as precious metals aim higher headed into the Federal Reserve meeting scheduled this week. The latest advance set forth by gold price action looks to tee up the shiny commodity for a potential topside breakout from its recent consolidation.


FOMC officials underscoring their dovish stance and commitment to keeping financial conditions accommodative likely stands to recharge the gold price rally. Commentary on the fresh implementation of average inflation targeting could bolster gold prices as well.
GOLD PRICE CHART WITH US DOLLAR INDEX & TEN-YEAR TREASURY YIELD OVERLAID: DAILY TIME FRAME (DEC 2019 TO SEP 2020)

Chart created by @RichDvorakFX with TradingView
That said, if the Fed decides to talk down markets, perhaps by emphasizing downside risks faced by the economy and growing disconnect between Wall Street and Main street, gold might face further headwinds. This is seeing that a pessimistic Fed has potential to ignite risk aversion and steer XAU/USD price action lower as the US Dollar catches bid alongside rising investor demand for safe-haven currencies.
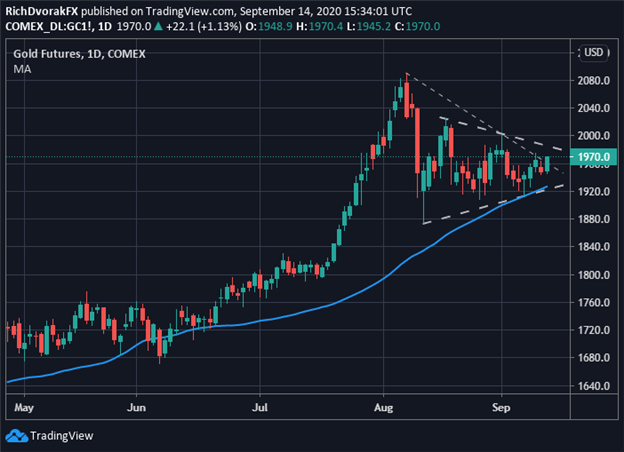
GOLD PRICE CHART: DAILY TIME FRAME (29 APR TO 14 SEP 2020)

Chart created by @RichDvorakFX with TradingView
The path of least resistance nevertheless appears tilted to the upside. Technical support around the $1,920/oz price level looks plentiful and shows potential to keep a floor under gold going forward. This area of support is also highlighted by the positively sloped 50-day moving average.
| Change in | Longs | Shorts | OI |
| Daily | 1% | -3% | -1% |
| Weekly | 2% | -8% | -2% |
Topping the August 18 close near $2,010 per ounce might encourage gold bulls to set their sights on fresh record highs. On the other hand, a breakdown of the symmetrical triangle consolidation pattern, perhaps identified by a close below the $1,920-price level, could suggest more turbulence ahead for gold.
Keep Reading: Gold Price Forecast Bright & Volatile as USD, Real Yields Swing
-- Written by Rich Dvorak, Analyst for DailyFX.com
Connect with @RichDvorakFX on Twitter for real-time market insight


