


Gold Price Forecast - Precious Metals Pressured as US Dollar Stabilizes; Chart Support in Sight
•Gold and silver prices have slumped to start the month of September
•XAU/USD price action peels back and probes a key support zone
•Precious metals could struggle if the US Dollar takes off
Precious metals stumbled lower last week with gold and silver prices declining about 2% a piece. The two shiny commodities failed to catch a bid despite broad-based investor risk aversion underpinned by a sharp pullback in major stock indices. Perhaps the powerful rebound staged by the US Dollar to start the month of September weighed negatively on XAU/USD price action.
Gold prices might face further headwinds if the Greenback can extend its aggressive rise off two-year lows. Another downside risk that could undermine gold price action includes potential for a widespread market sell-off earmarked by a ‘dash to cash.’
Gold Price Chart with US Dollar Index Overlaid: Daily Time Frame (28 Apr to 04 Sep 2020)
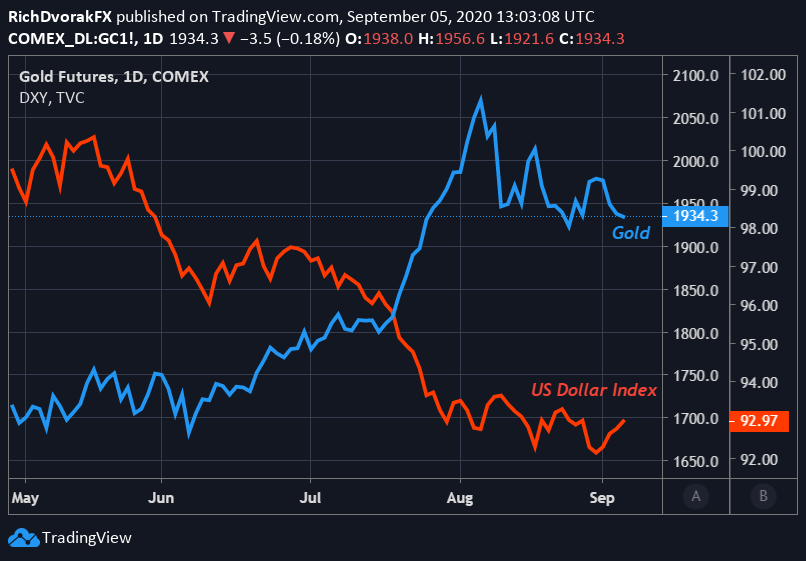
Chart created by @RichDvorakFX with TradingView
That said, a daily gold chart shows the precious metal perched upon a key support zone. The $1,915-price level stands out as a critical area of technical support that could stymie gold selling pressure. This area of confluence around the $1,900-handle is highlighted by August lows. Not to mention, gold price action has notched a series of higher lows on a closing basis over the last few trading sessions, which likely helps keep upward biases intact.
| Change in | Longs | Shorts | OI |
| Daily | 1% | -3% | -1% |
| Weekly | 2% | -8% | -2% |
Gold Price Chart: Daily Time Frame (28 Apr to 05 Sep 2020)
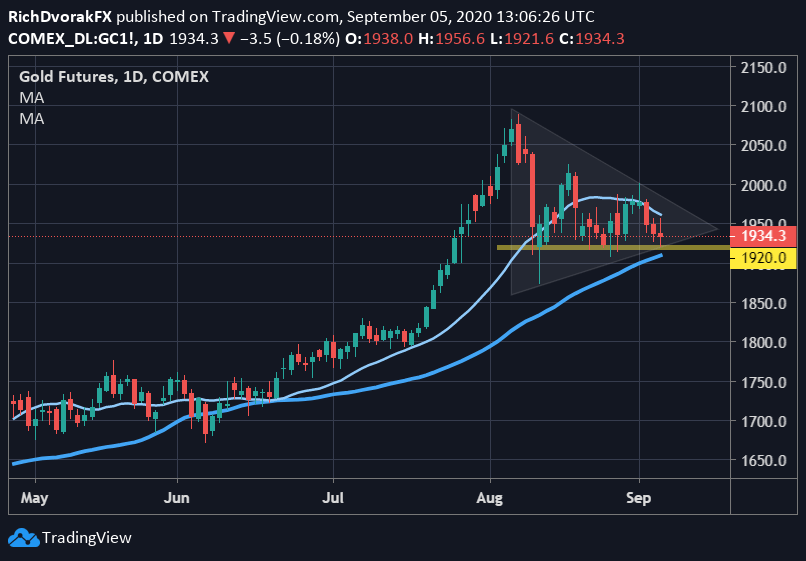
Chart created by @RichDvorakFX with TradingView
Yet, the precious metal has recorded a string of lower highs as well, with gold consolidating lower from its all-time high above $2,000/oz printed early last month. This conflict between short-term rising and falling trend lines appears to have formed a symmetrical triangle pattern. Also, as gold bulls and bears battle over bullion’s next direction, trader indecision appears to have formed a doji candlestick on Friday. Also, gold is now wedged between its bullish medium term 50-day moving average and bearish 20-day moving average.

Reclaiming the 20-day moving average could open up the door for a retest of the psychologically-significant $2,000-price level before record highs come back into consideration. Breaching the 50-day moving average and 12 August intraday swing low could indicate a larger pullback may be in the cards for gold price action.
Keep Reading: Gold Forecast Bright & Volatile as USD, Real Yields Swing
-- Written by Rich Dvorak, Analyst for DailyFX.com
Connect with @RichDvorakFX on Twitter for real-time market insight


