


EUR/USD and EUR/GBP Prices, News and Analysis:
DailyFX Economic Data and Events Calendar
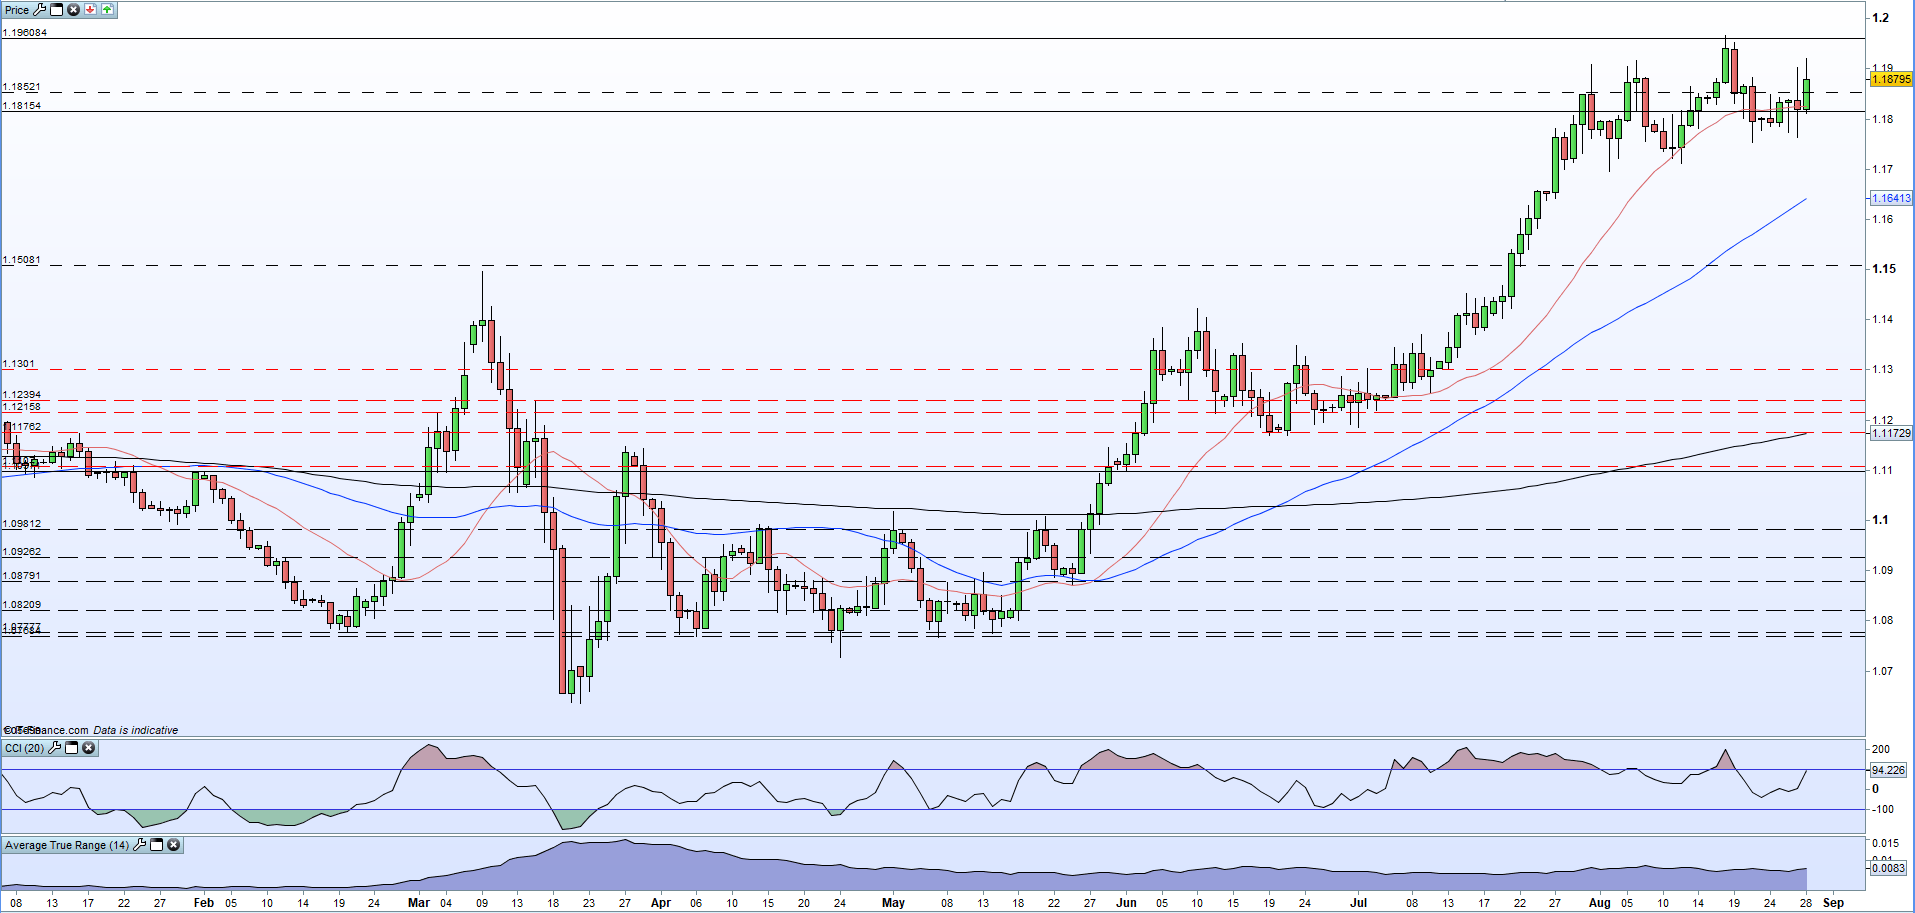
EUR/USDcontinues to benefit from US dollar weakness and recently touched a new 27-month high and is within striking distance of 1.2000, a level last seen at the end of April 2018. While the single currency is mildly stronger, the majority of the recent move is down to ongoing US dollar, given another nudge on Thursday by a dovish Jerome Powell speech. The daily chart remains positive, especially with the pair back above the 20-dma, and any short-term sell-off should stall around the 1.1750-1.1770 level if it happens. The path of least resistance is a gradual grind higher with the psychological big figure of 1.2000 the next target. The pair are just about to enter overbought territory, maybe slowing further upside, while volatility has remained relatively stable around 80 pips.

EUR/USD Daily Price Chart (January – August 28, 2020)
| Change in | Longs | Shorts | OI |
| Daily | -1% | -4% | -3% |
| Weekly | 4% | -10% | -5% |
Find Your Trading Style – What is Your Trading Personality?
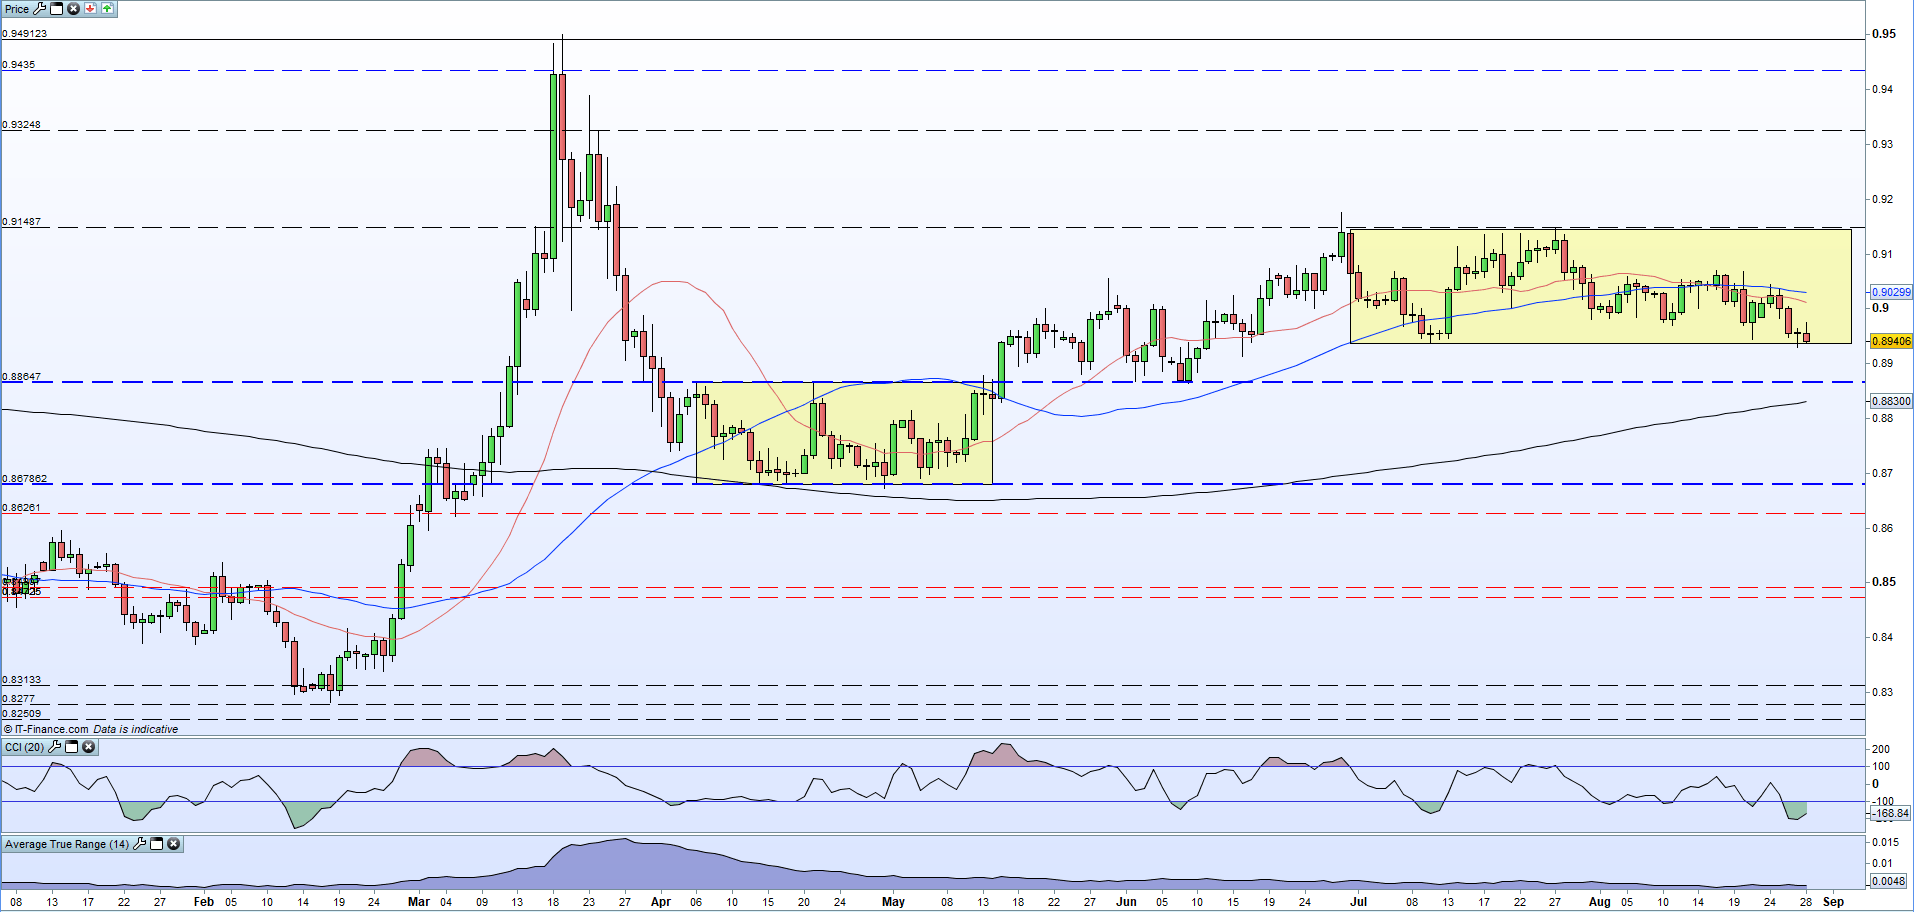
EUR/GBP has remained rangebound for the last few weeks but a bout of Sterling strength is pressing the pair down onto support around 0.8935. This week’s move lower has seen EUR/GBP drop below both the 20- and 50-dmas, while the CCI indicator shows the pair as sharply oversold. Support off the old resistance line at 0.8865 which guards the 200-dma at 0.8830. It may need a strong fundamental driver to push the pair any lower in the short-term. The previously mentioned 20- and 50-dmas offer resistance at 0.9010 and 0.9028 respectively, before the August 17 high of 0.9070 comes into play. Current price action suggests that a break and open below support is looking more likely than not.

EUR/GBP Daily Price Chart (January – August 28, 2020)
What is your view on EUR/USD and EUR/GBP – bullish or bearish?? You can let us know via the form at the end of this piece or you can contact the author via Twitter @nickcawley1.


