


EURO TECHNICAL FORECAST: EUR/USD PRICE PIVOTS LOWER, EUR/GBP MAINTAINS RANGE, EUR/CAD RECORDS BEARISH TURN
- Euro bulls show more signs of exhaustion as EUR/USD, EUR/GBP, EUR/CAD edge lower
- EUR/USD price action eyes month-to-date lows amid mounting downward pressure
- EUR/GBP could drift sideways and EUR/CAD may be on the cusp of a big breakdown
Euro selling pressure seems to be gaining traction. This comes as the bloc currency pulls back from six-year highs according to a trade-weighted index tracked by the European Central Bank. The move lower by the broader Euro corresponds with EUR/USD price action struggling to make headway into the 1.1900-handle, which marks two-year highs for the most liquid and heavily traded major currency pair.
EUR/USD PRICE CHART: DAILY TIME FRAME (27 APR TO 21 AUG 2020)

With Euro strength wavering, and downward pressure faced by EUR/USD mounting, negative divergence on the RSI has developed. Also, spot EUR/USD just closed below its 8-day moving average, which points to a possible bearish shift in sentiment. This follows a 180-pip reversal from the 18 August intraday high as EUR/USD bears stand their ground with the help of a fundamental push from Markit PMI data.
| Change in | Longs | Shorts | OI |
| Daily | -1% | -4% | -3% |
| Weekly | 4% | -10% | -5% |
That said, the Euro could continue its recent drop against the US Dollar into next week and potentially gravitate toward the 1.1700-price mark. This zone of technical confluence is underpinned approximately by the 34-day moving average, 23.6% Fibonacci retracement of its latest bullish leg, and current month-to-date lows.
EUR/GBP PRICE CHART: DAILY TIME FRAME (27 APR TO 21 AUG 2020)

EUR/GBP slipped to its lowest level in five weeks on an intraday basis this past Friday, but spot prices recovered modestly to close around the 0.9000-level. This might reiterate the rough 225-pip trading range that EUR/GBP price action has oscillated within since the Euro-Pound topped out on 29 June. Potential for EUR/GBP to continue drifting broadly sideways is hinted at by the ongoing Bollinger Bands squeeze.
| Change in | Longs | Shorts | OI |
| Daily | -4% | -2% | -4% |
| Weekly | -9% | 5% | -6% |
Spot EUR/GBP prices could thus keep ping-ponging back and forth between this dynamic channel of technical support and resistance as currency volatility compresses. This largely neutral narrative is reinforced by murky fundamental undercurrents like Brexit talks offsetting possible Euro weakness against the British Pound. Although, the negatively-sloped 20-day moving average is noteworthy, and may indicate that risk is tilted to the downside as a bearish trend starts to emerge.
EUR/CAD PRICE CHART: DAILY TIME FRAME (01 FEB TO 21 AUG 2020)
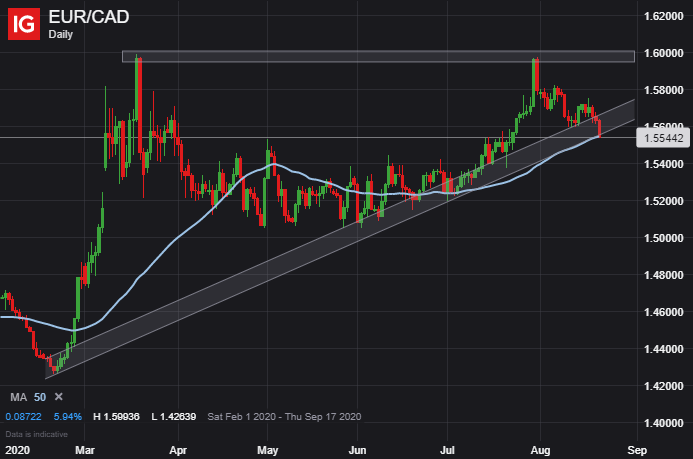
EUR/CAD has succumbed to heightened selling pressure as well. Since printing a possible double top pattern at the 1.6000-handle, a sustained stretch of Euro weakness relative to the Canadian Dollar has sent EUR/CAD price action spiraling lower into its 50-day moving average. This technical indicator currently resides slightly below the 1.5550-mark.

Yet, another push lower by EUR/CAD next week could invalidate the standing bullish trend detailed by a series of higher lows since late February. A breakdown beneath this barrier of technical support might motivate EUR/CAD bears to make a bigger push toward the 1.5400-zone before early July lows come into consideration as another potential downside target. Holding this key level, however, could reinvigorate Euro bulls to send EUR/CAD price action recoiling back higher.
-- Written by Rich Dvorak, Analyst for DailyFX.com
Connect with @RichDvorakFX on Twitter for real-time market insight


