


Indices Highlights:
- Dow Jones rebound closes gap, resistance ahead
- DAX run could get cut short soon with price pattern building
- FTSE 100 lagging behind other indices, puts it at larger risk of decline
Dow Jones rebound closes gap, resistance ahead
The Dow Jones closed the gap from March 12 at 23553, and is now working on possibly trading up to the trend-line extending from the 2016 correction low that passes under the low created in December 2018. This could be a spot that the recovery gets put to a true test. It seems unlikely an advance, if it is to continue, will do so with some bumps along the way. With that said, there is a channel also developing off the low that traders can use as a guide. Stay within (even if while testing resistance), then price will remain pointed higher to sideways at worst. However, fall outside of the channel and we could see the Dow take a dive lower.

Dow Jones Daily Chart (level ahead to watch, channel as guide)

Dow Jones Chart by TradingView
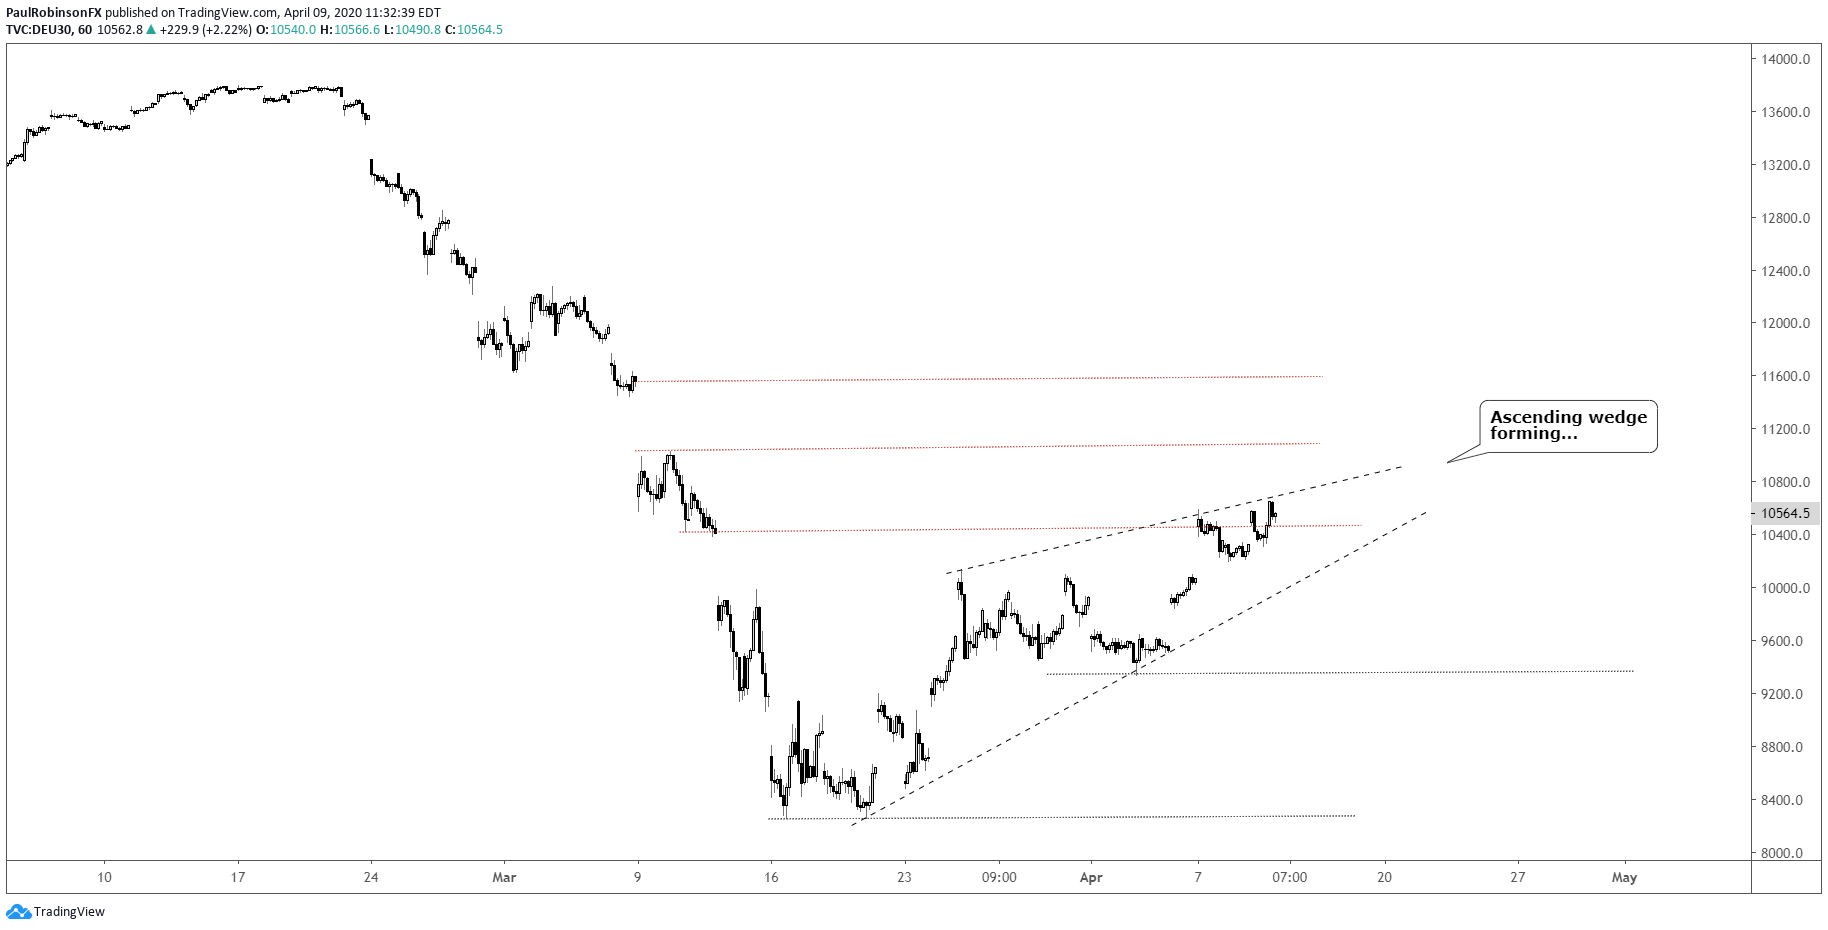
DAX run could get cut short soon with price pattern building
The DAX is still putting together a healthy recovery, but could get cut short if an ascending wedge forming on the hourly chart has anything to say about it. The developing pattern, though, won’t be validated until it is broken, which will require price to undercut the rising underside trend-line. The first target on the downside will be 9337. However, until the pattern breaks the near-term outlook will remain bullish. The gap from March 12 was already filled, with another one just ahead between 11032 and 11555.
DAX Hourly Chart (ascending wedge, levels to watch)
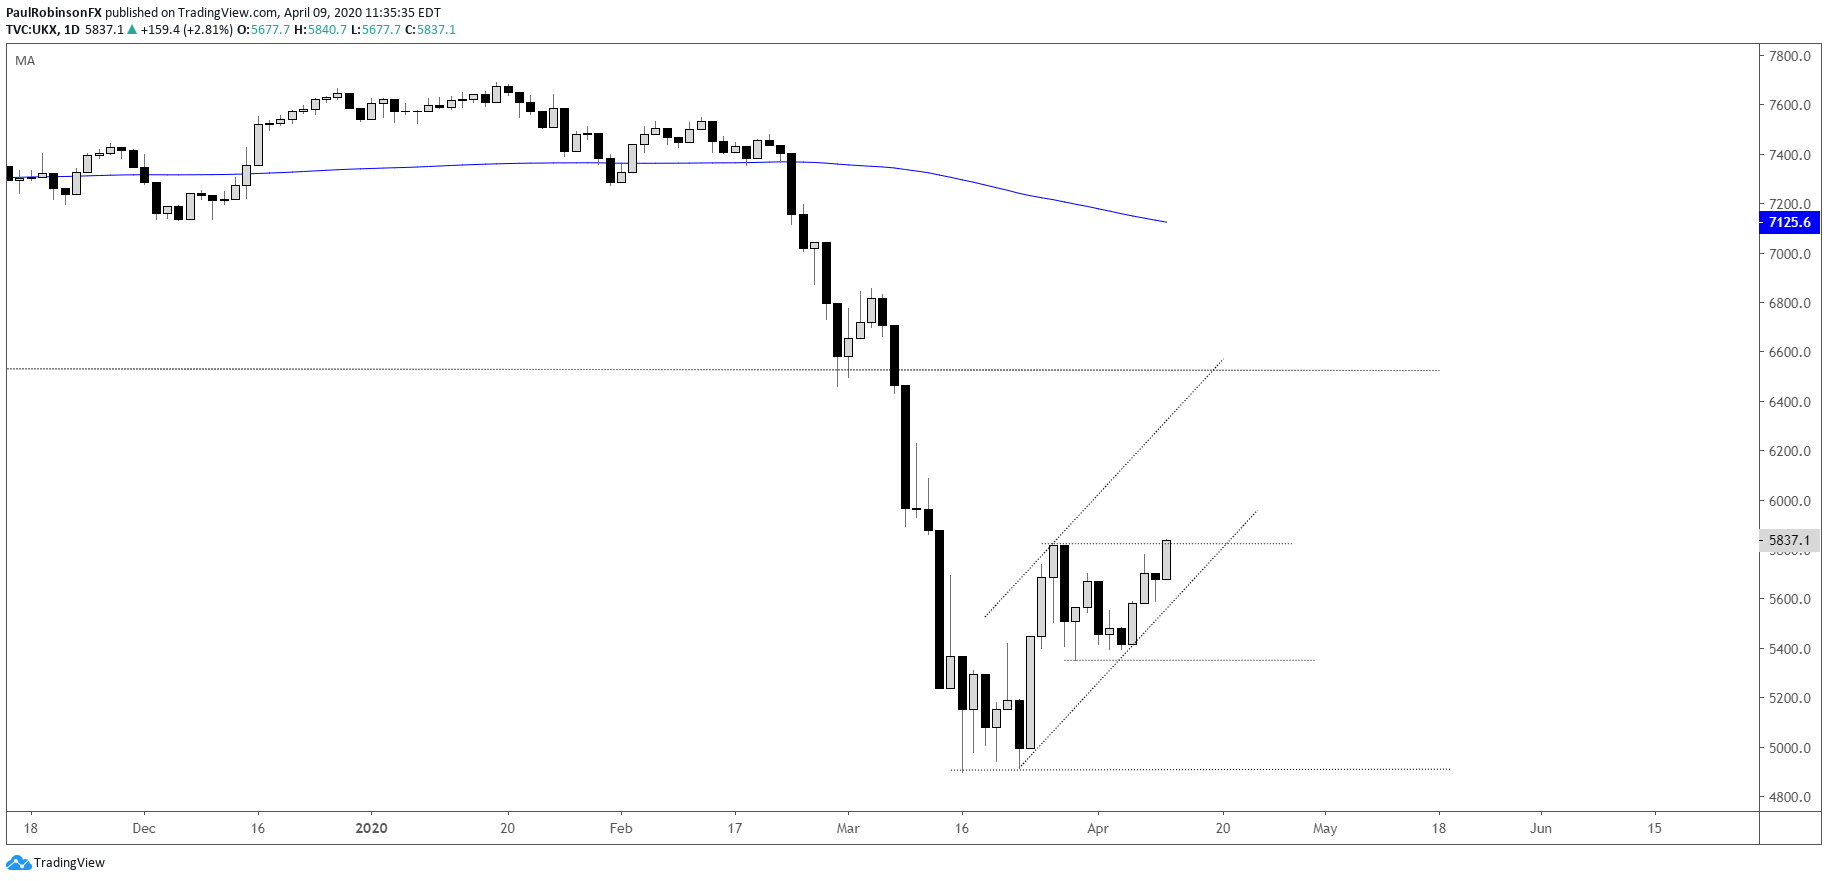
FTSE 100 lagging behind other indices, puts it at larger risk of decline
The FTSE has lagged other major indices as it is just working on crossing above the March 26 high. It is working on a building a channel, that if maintained will keep the upside in check. But if it breaks the likelihood of a decline will increase, and it could be faster than other indices as it has exhibited a good amount of relative weakness.. For now, though, the outlook is fairly neutral.

FTSE Daily Chart (lagging behind)
Forex & CFD Trader Resources
Whether you are a new or experienced trader, we have several resources available to help you; indicator for tracking trader sentiment, quarterly trading forecasts, analytical and educational webinars held daily, trading guides to help you improve trading performance, and one specifically for those who are new to forex.
---Written by Paul Robinson, Market Analyst
You can follow Paul on Twitter at @PaulRobinsonFX


