


DAX 30 & FTSE 100 Analysis and News
Equity market volatility remains elevated, as such, with uncertainty continuing to plague global markets, the bottom appears yet to be reached. An implosion on global bond yields as central banks (Fed, BoC, RBA) ease monetary policy, provides a worrying signal for equity markets.
DAX 30 | Clinging onto Support
The DAX fails to escape the equity carnage as the closes the week with losses of 2.9%. After the Fed provided an emergency cut, all eyes will be on the ECB as they look to announce a series of measures to aid the Eurozone. On the technical front, the DAX remains weak with bounces proving short-lived. That said, 11,500 has held thus far for the DAX, although with risks remaining tilted to further declines, eyes will be on the July 2019 lows.
| Change in | Longs | Shorts | OI |
| Daily | -9% | 7% | 2% |
| Weekly | -27% | 9% | -5% |
| Support | Resistance | ||
|---|---|---|---|
| 11500 | - | 12000 | 200WMA |
| 11265 | July 2019 low | 12290 | Weekly High |
| 11036 | 76.4% Fib | 12500 | - |
DAX 30 Price Chart: Daily Time Frame
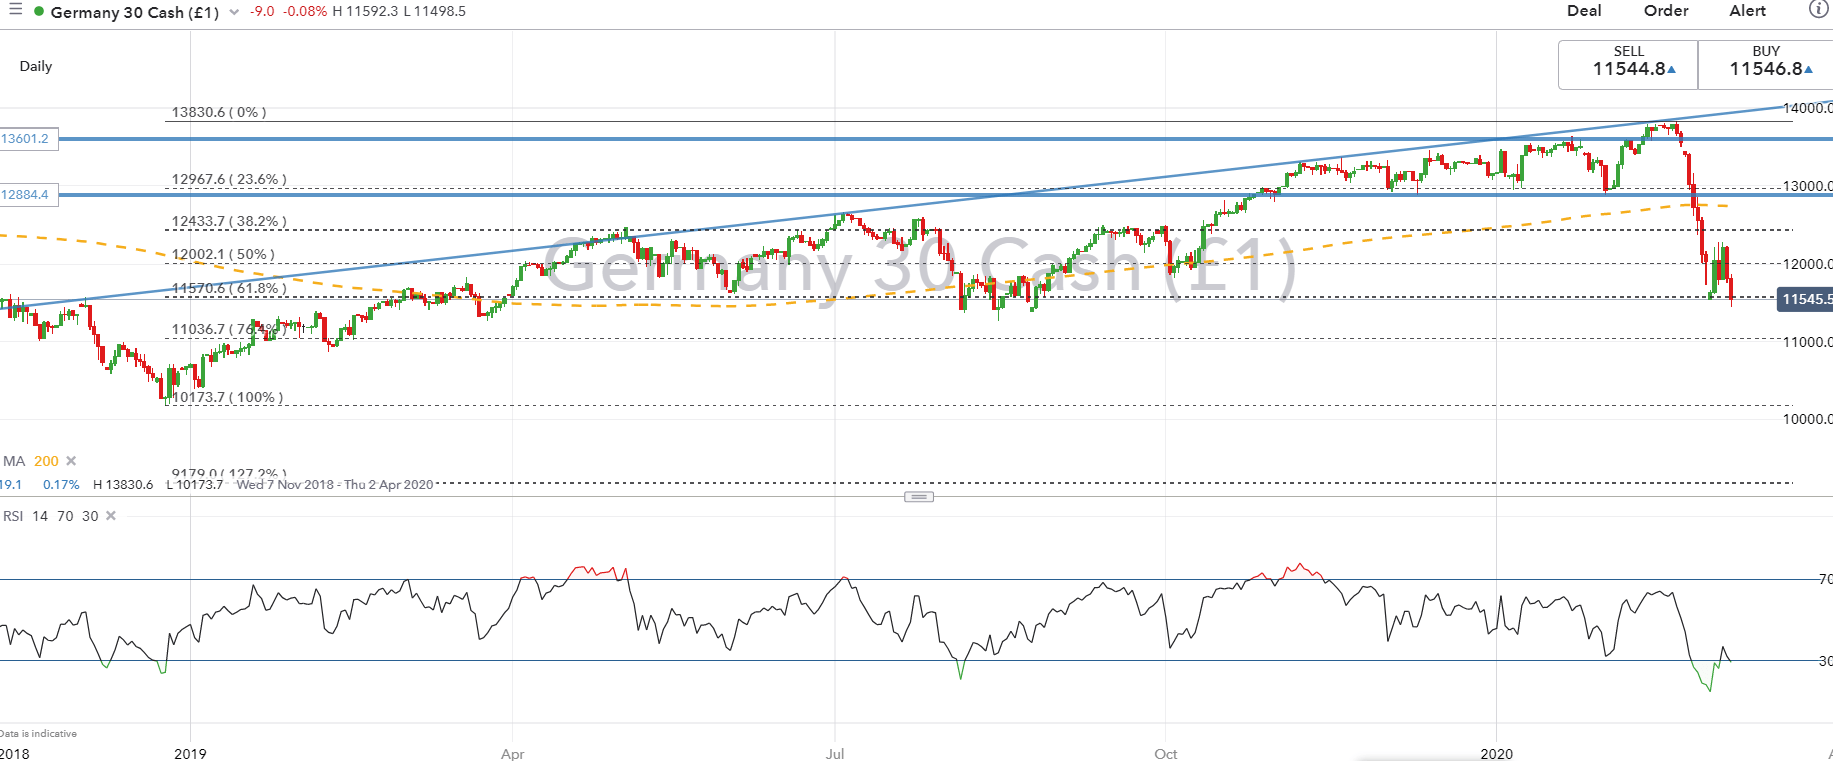
Chart by IG
FTSE 100 | Key Support to Offer Temporary Bounce
Little respite for the FTSE 100 after posting its largest sell-off since the financial crisis, the index extended on its losses, closing the week down 1.8%. As such, with rising volatility keeping the FTSE 100 on the backfoot, the index sets its sights on for a test of 6419 (61.8% Fib). However, while this may offer an opportunity for a short-term bounce, the absence of positive news would likely see a bounce remain shallow.
| Support | Resistance | ||
|---|---|---|---|
| 6419 | 61.8% Fib | 6703 | 50% Fib |
| 6400 | - | 6856 | Weekly High |
| 6200 | - | 6900 | - |

FTSE 100 Price Chart: Weekly Time Frame
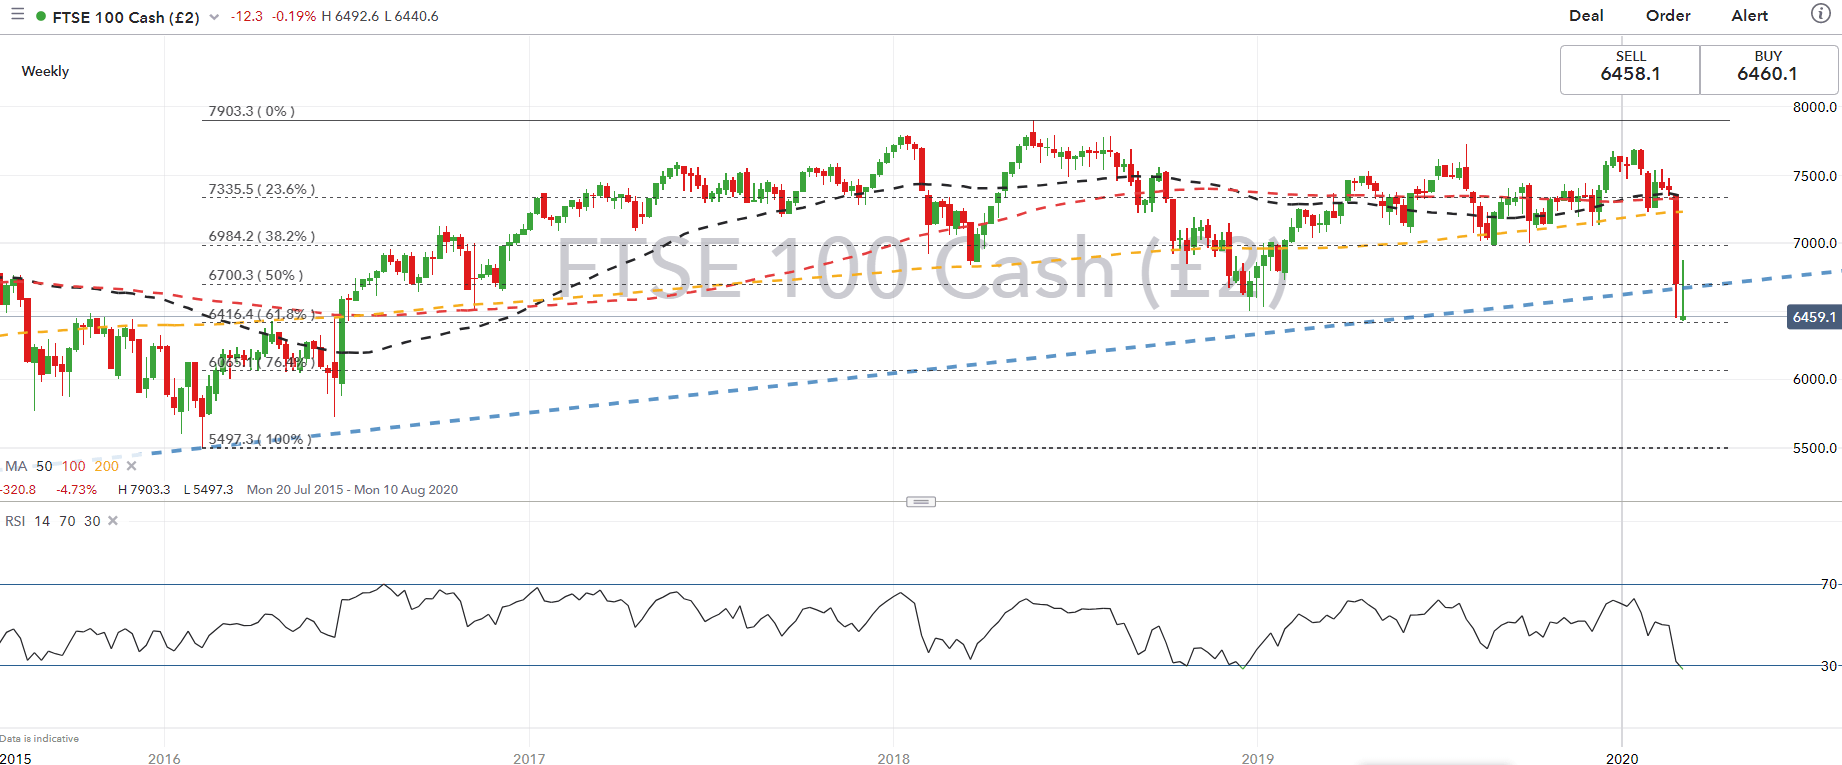
Chart by IG
RESOURCES FOR FOREX & CFD TRADERS
Whether you are a new or experienced trader, we have several resources available to help you; indicator for tracking trader sentiment, quarterly trading forecasts, analytical and educational webinars held daily, trading guides to help you improve trading performance, and one specifically for those who are new to forex.
--- Written by Justin McQueen, Market Analyst
Follow Justin on Twitter @JMcQueenFX


