


Dow Jones, Nasdaq 100, S&P 500, DAX 30 Technical Outlooks:
- The Dow Jones suffered its worst weekly decline since the Great Financial Crisis
- The Nasdaq 100 plummeted to key technical support at the 200-day simple moving average
- The DAX 30 crashed beneath a plethora of technical levels and has erased gains since August
Dow Jones Technical Forecast
Outlook: Neutral
Stocks suffered one of the most catastrophic weekly declines in history last week as the Dow Jones, Nasdaq and S&P 500 fell nearly 14% from recent highs that were established just ten days prior. While the fundamental landscape remains dauntingly uncertain and remarkable, brave technical traders may begin to wade back into the market as the major indices tread water around crucial support levels. Still, there are considerations to be made.
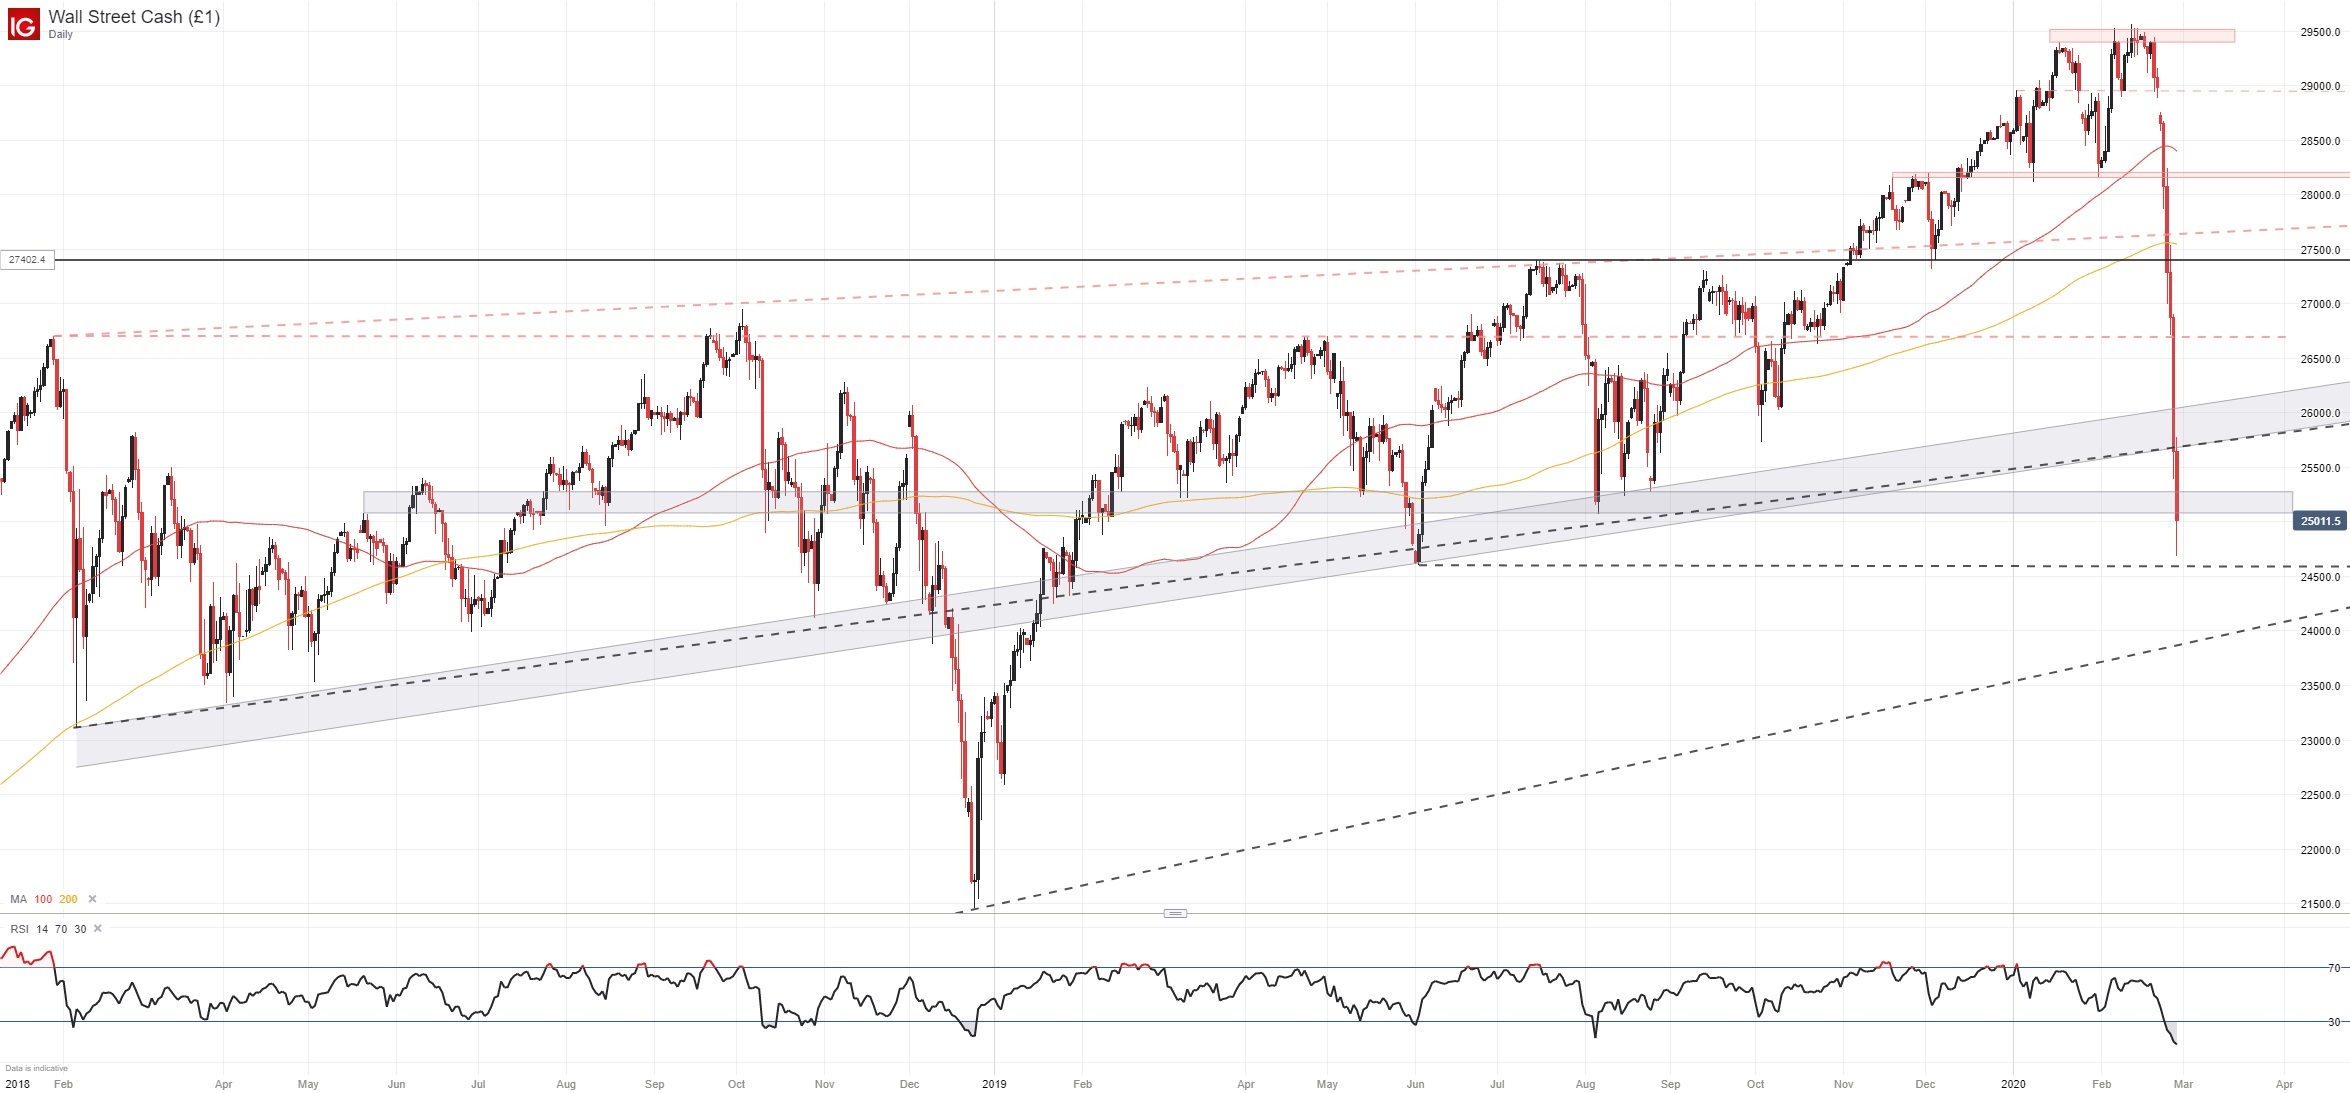
Dow Jones Price Chart: Daily Time Frame (January 2018 – February 2020)
Day Trading the Dow Jones: Strategies, Tips & Trading Signals
To be sure, any form of analysis can lose its efficacy in times of market extremes – which we are certainly in the midst of. With that in mind, trading during times of historically high volatility carries heightened risk and should be accompanied with proper risk management. That being said, the Dow Jones chart has begun to show inklings a rebound is possible.
Will the Stock Market Crash in 2020?
Last week I highlighted key support zones on the Industrial Average, both of which appeared to offer some degree of price influence. Closing above support and accompanied by a modest lower wick, Friday’s price action may suggest bulls have waded back into the market. With RSI deep in oversold territory, the evidence for a recovery rally is building. If recovery attempts fizzle out, initial support should coincide with the index’s June low, followed by the ascending trendline from the 2016 and 2018 lows beneath.
Nasdaq 100 Technical Forecast
Outlook: Neutral
The Nasdaq’s crash saw the tech-heavy index fall to confluent support around the 200-day moving average and two nearby trendlines. All three are formidable technical levels and should provide a considerable barrier to further losses – though nothing is certain and last Monday saw the largest lower gap for the Nasdaq since 2015. Also oversold, the Nasdaq may enjoy a bounce if bulls are willing, but a break beneath support could result in a serious extension lower as levels become more difficult to identify.
Nasdaq 100 Price Chart: Daily Time Frame (July 2018 – February 2020)
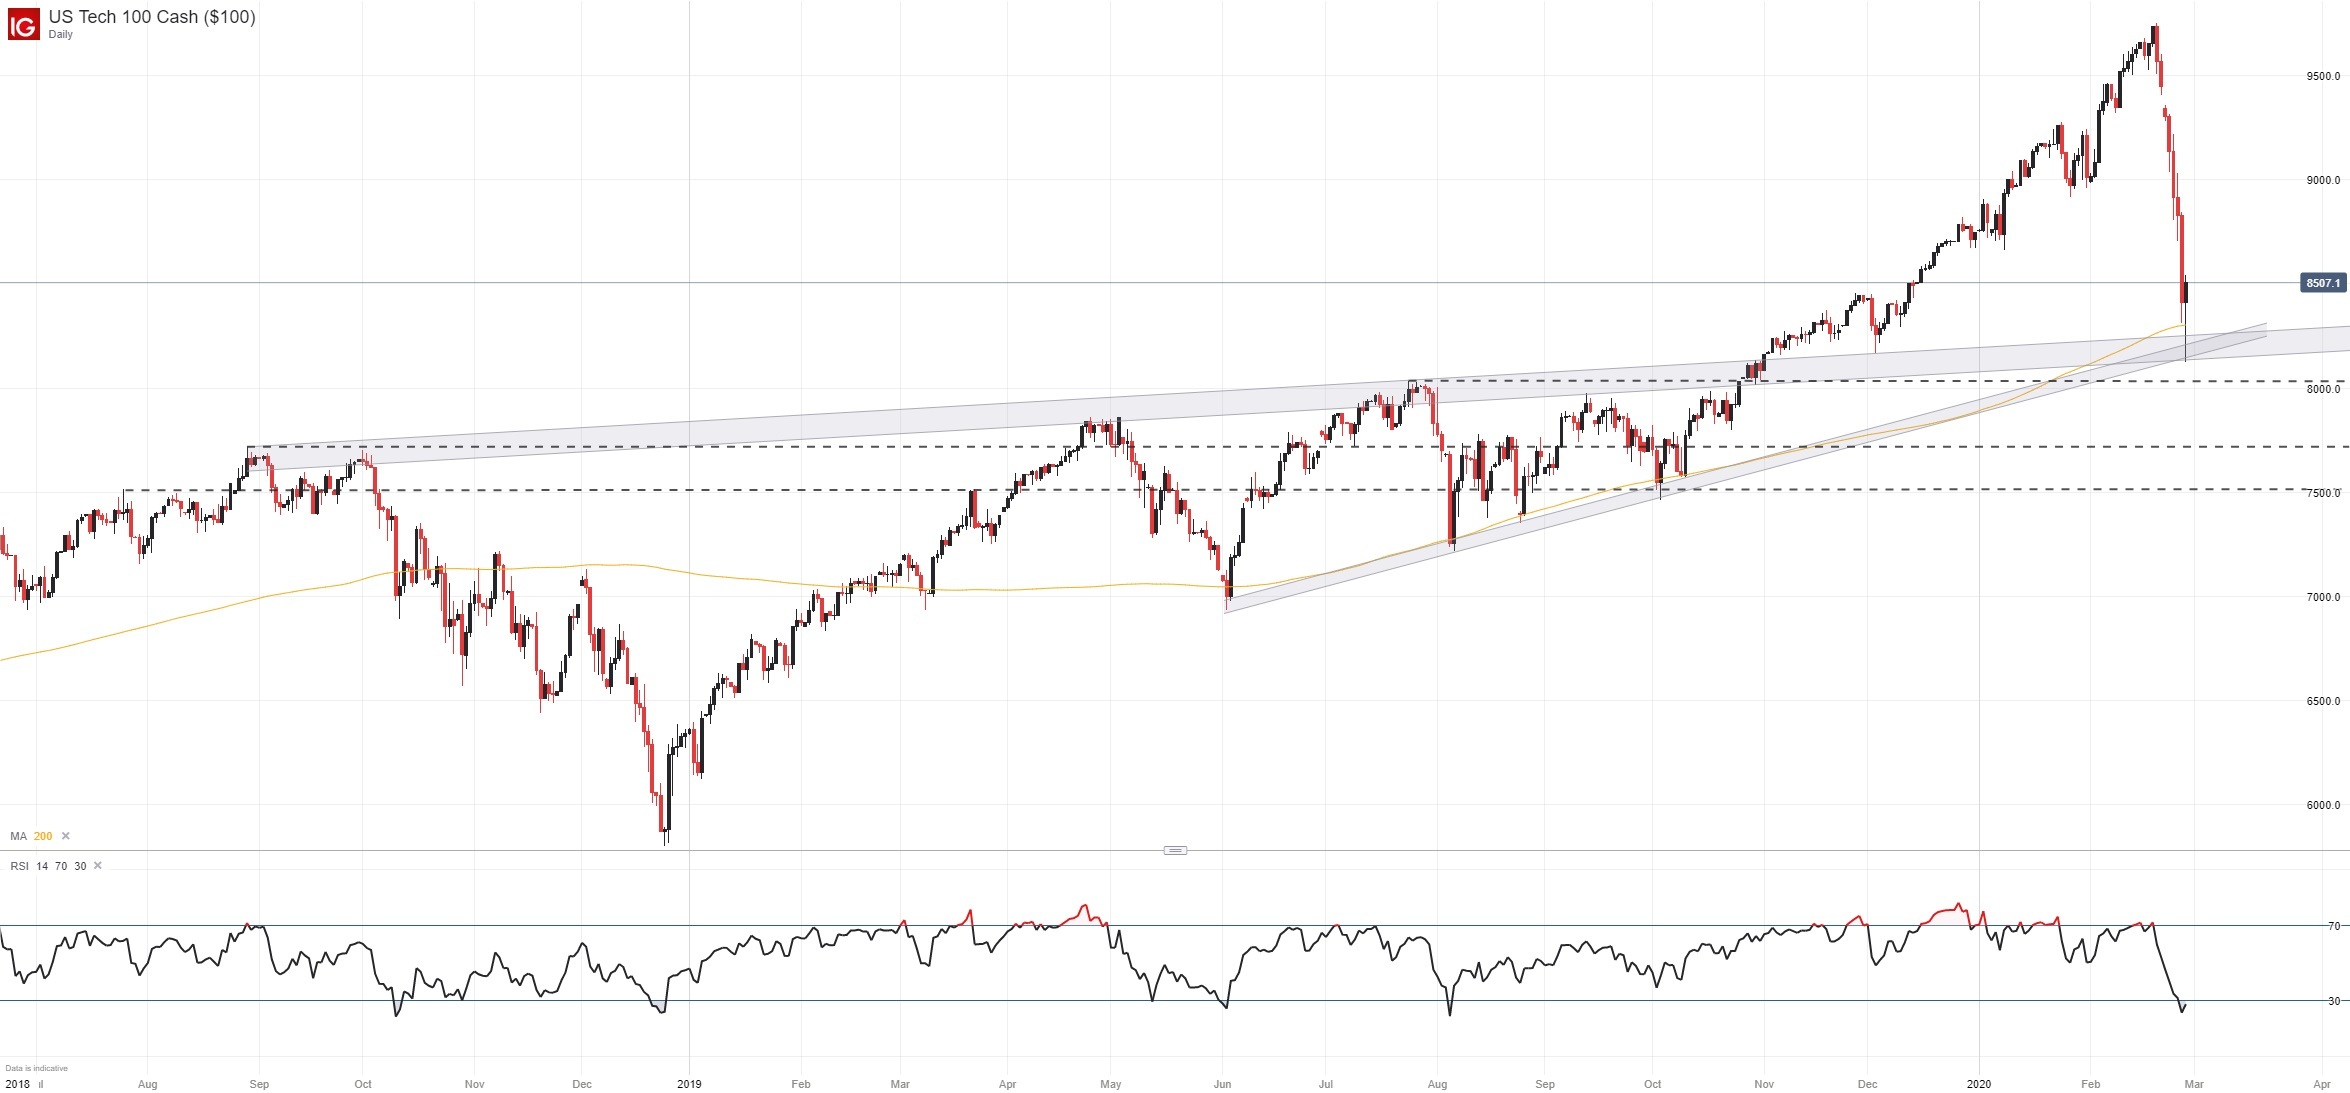
Potential support may exist at the July 2019 high, slightly north of 8,000, follow by the August 2018 high around 7,727 followed by 7,500. Still, the fundamental landscape has few precedents and further losses could materialize, a theme I discussed this theme at length in last week’s stock market webinar.
S&P 500 Technical Forecast
Outlook: Neutral
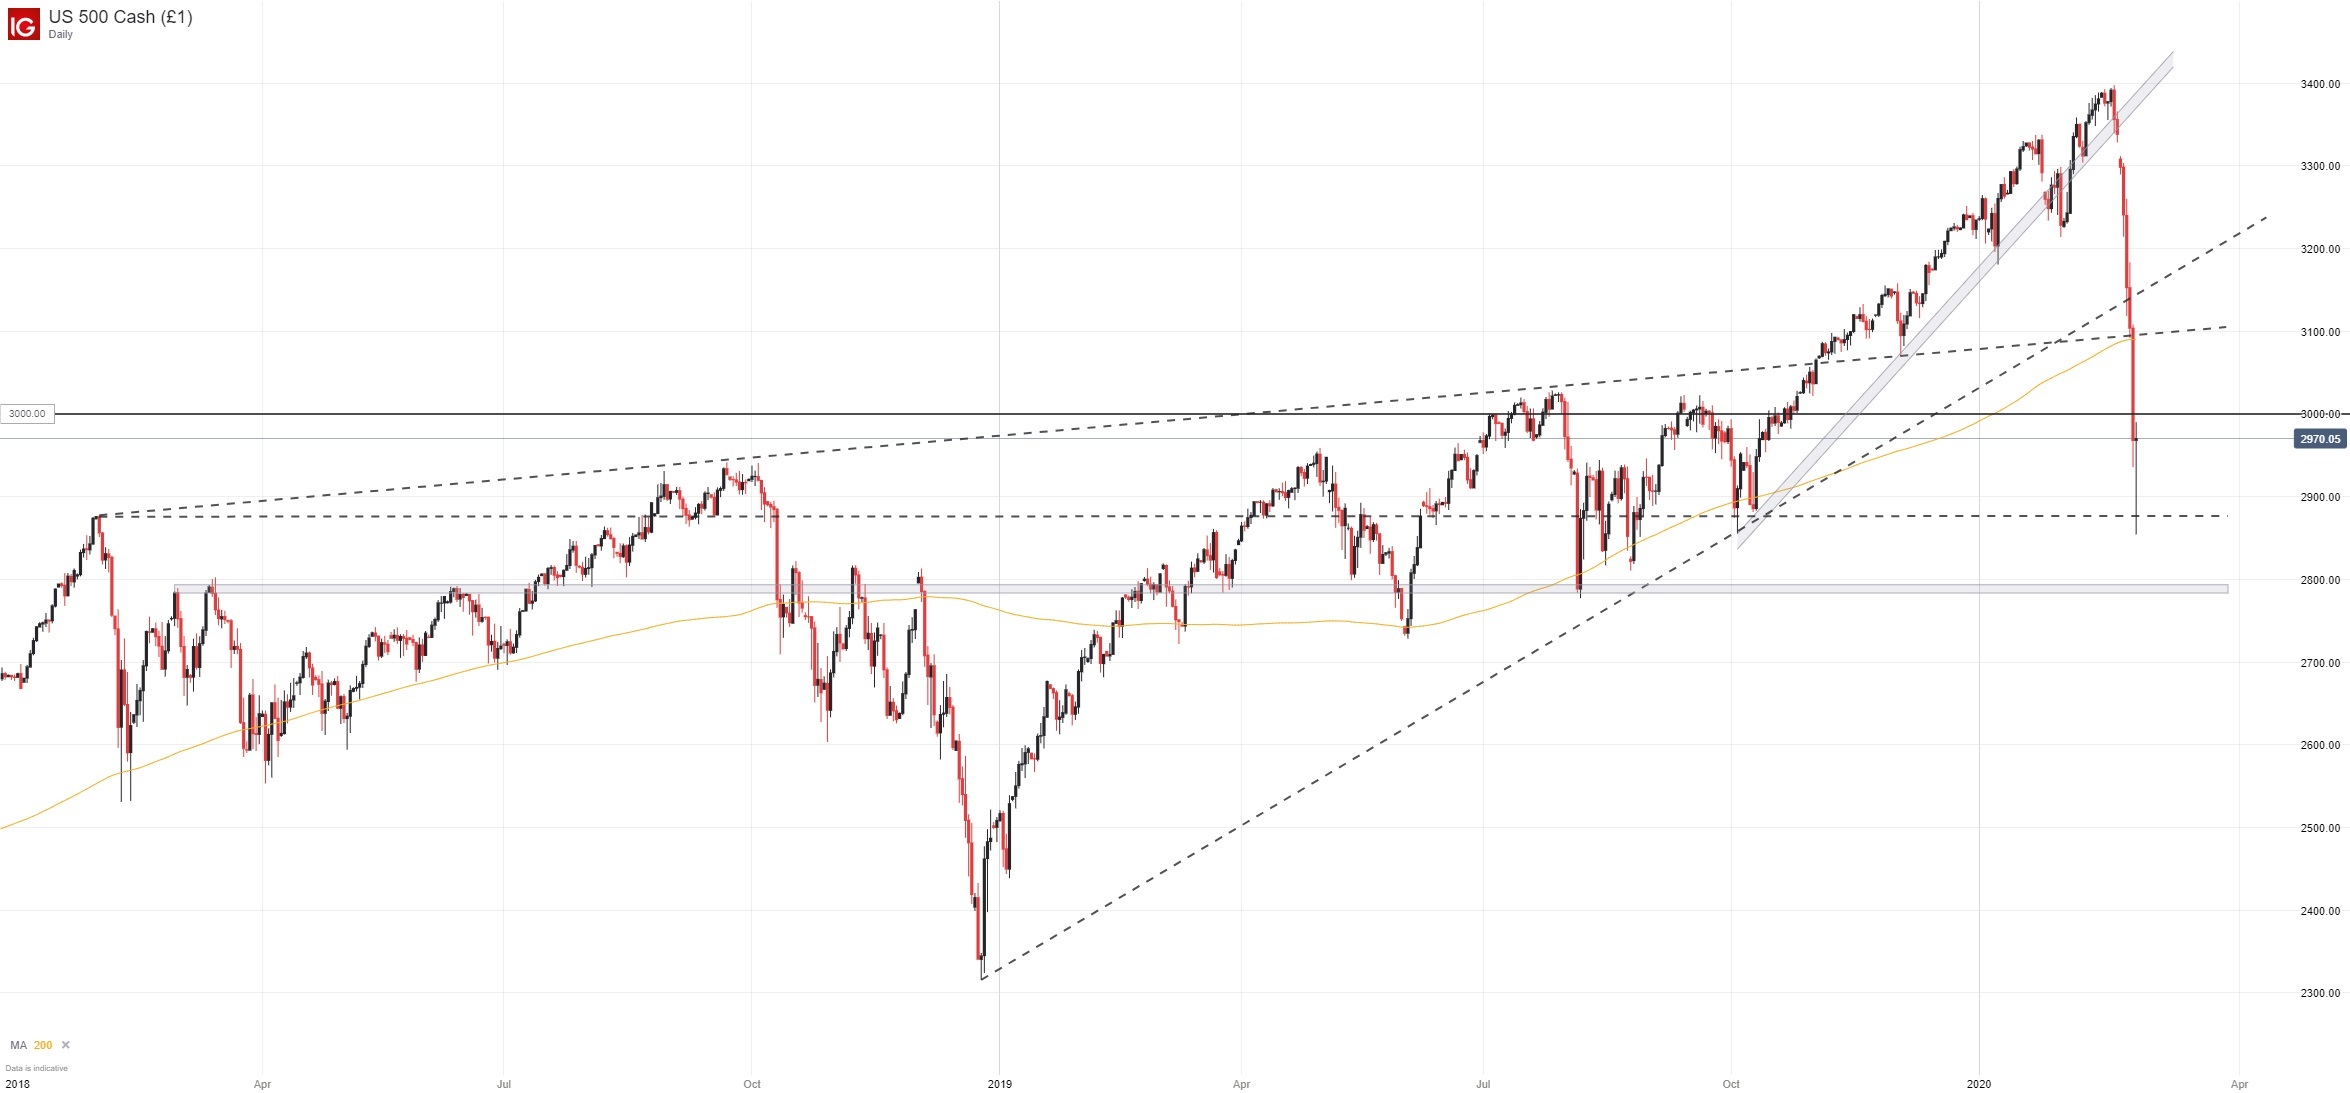
The S&P 500 also took out key levels last week, diving beneath the psychologically significant 3,000 mark with ease. As a result, the index was allowed to continue lower before it eventually stalled at the January 2018 high around 2,878 which will now look to act as initial support in the week ahead. Should it fail, secondary support of note may materialize around 2,800 which has stalled price action numerous times in the past.
S&P 500 Price Chart: Daily Time Frame (January 2018 – February 2020)
DAX 30 Forecast
Outlook: Neutral
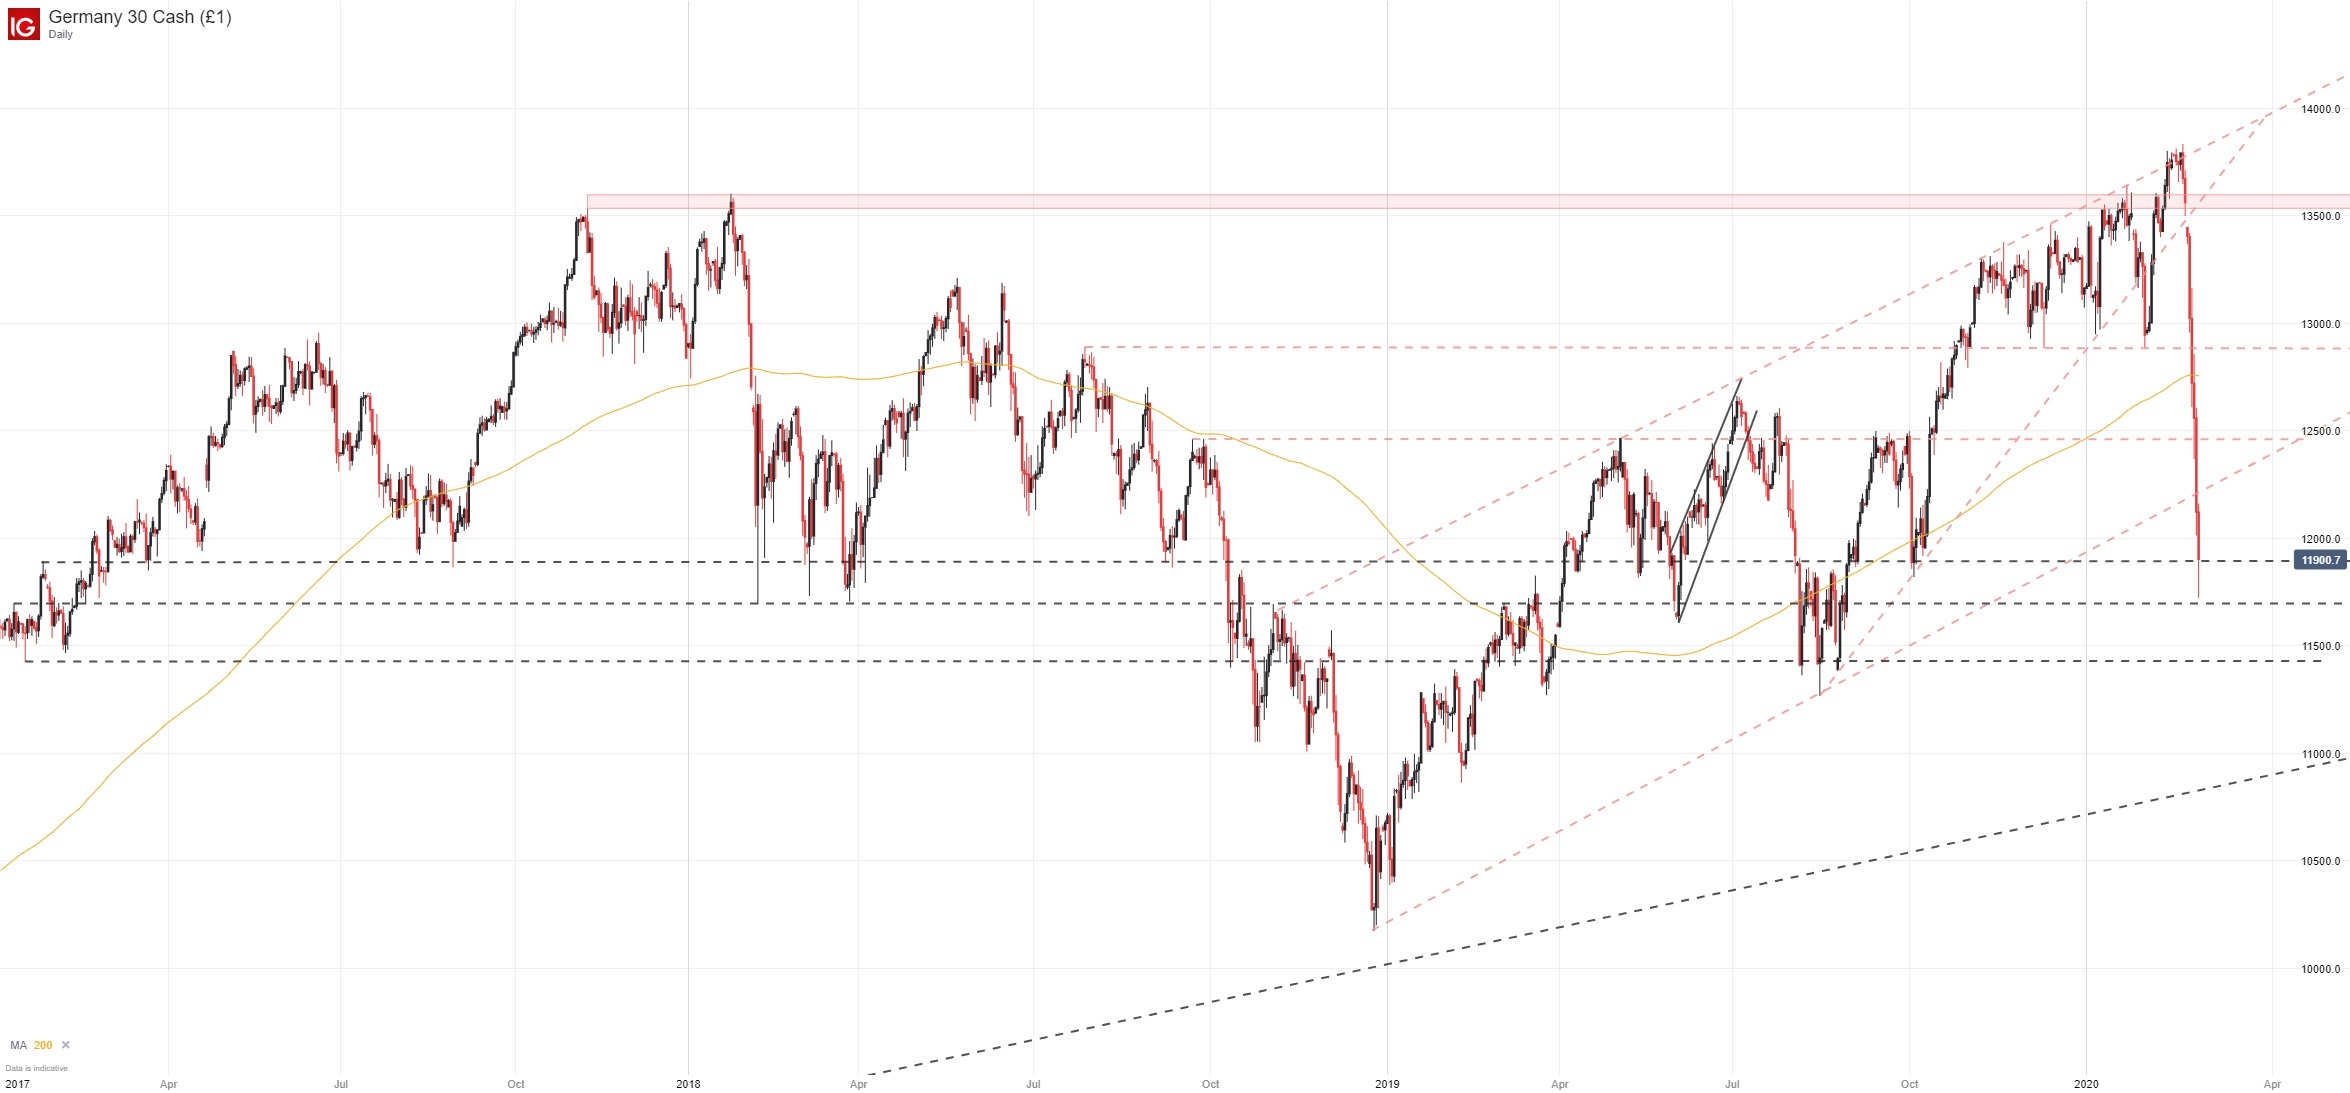
The DAX 30 was not insulated from the global equity rout as it too broke beneath its 200-day simple moving average. Now the German equity index will look for supplemental support around 11,690 and 11,427.
DAX 30 Price Chart: Daily Time Frame (March 2017 – February 2020)
How to Trade Dax 30: Trading Strategies and Tips
Along with the Dow Jones, Nasdaq and S&P 500, the DAX 30 will have to surmount support-turned resistance if gains are established next week. Since a string of major levels have been surrendered, any attempt to retake higher ground will likely experience noteworthy resistance.
In the meantime, follow @PeterHanksFX on Twitter for updates and insights. It is also important to note I maintain a slightly bullish bias from a technical perspective, but the pandemonium and unpredictability of the current stock market climate results in a neutral forecast for the markets above, awaiting further clarity.

--Written by Peter Hanks, Junior Analyst for DailyFX.com


