


Stock Market Crash Update:
- The Dow Jones has taken out various technical levels of historical significance
- The S&P 500 sank to 2,875 which marks the January 2018 high
- Will the Stock Market Crash in 2020?
Stocks Crash as Dow Jones, S&P 500 Erase Months of Gains in Days
The Dow Jones fell another 1,000 points (-3.5%) on Friday after suffering its largest point drop in history the day prior, before rebounding slightly as the session progressed. In percentage terms, the weekly decline has seen the Industrial Average fall roughly 14.5% while the S&P 500 is off nearly 14%. Days of declines and uncertainty have pushed the VIX to 49.5 – the highest level for the “fear index” since February 2018 when it tagged 50.3.
VIX Price Chart Overlaid with S&P 500
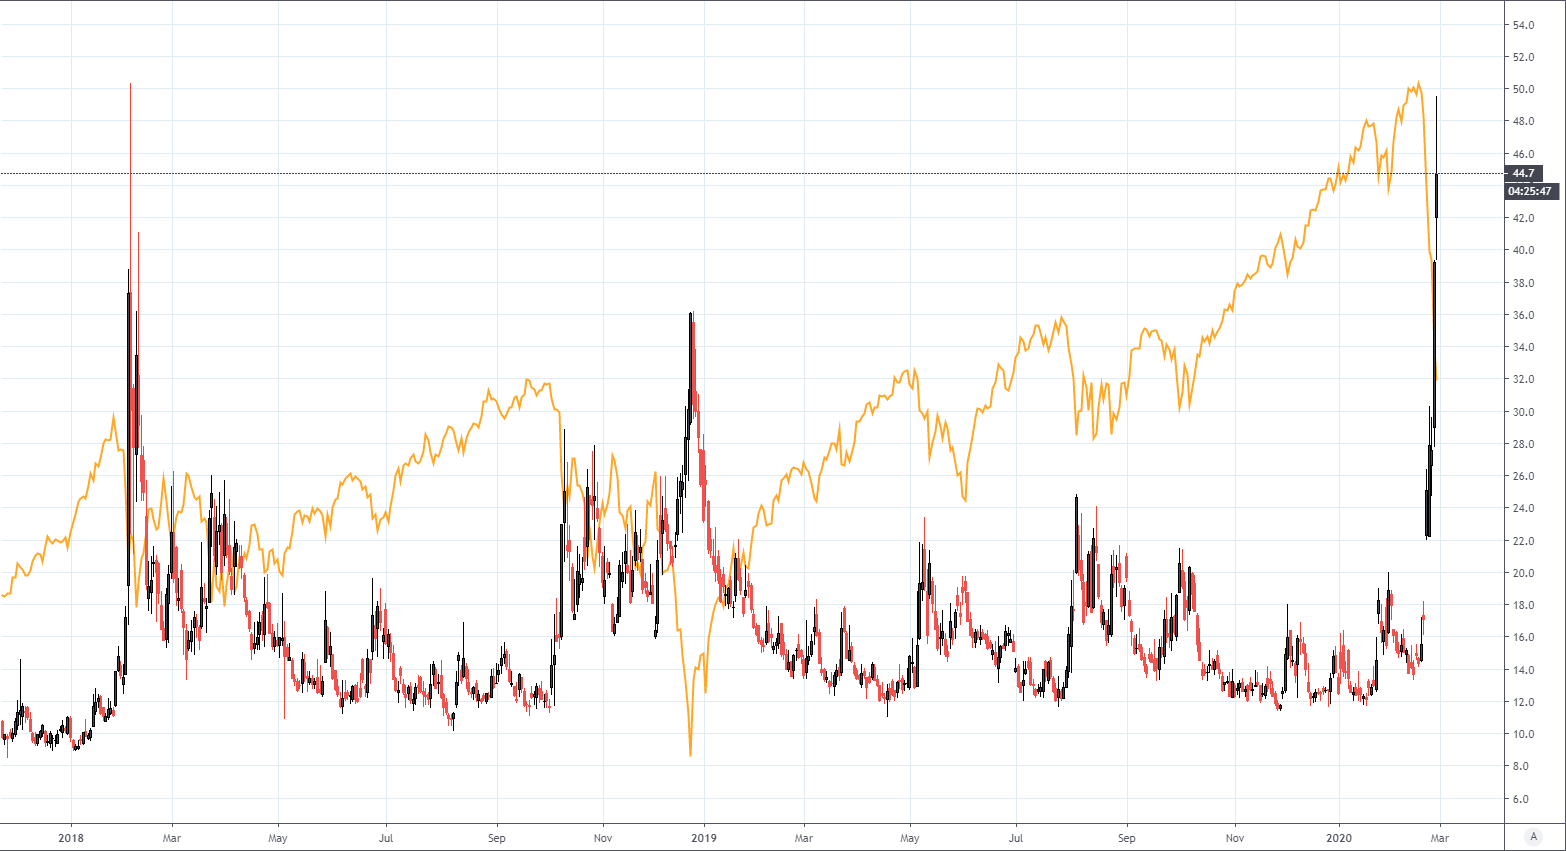
Chart created with TradingView
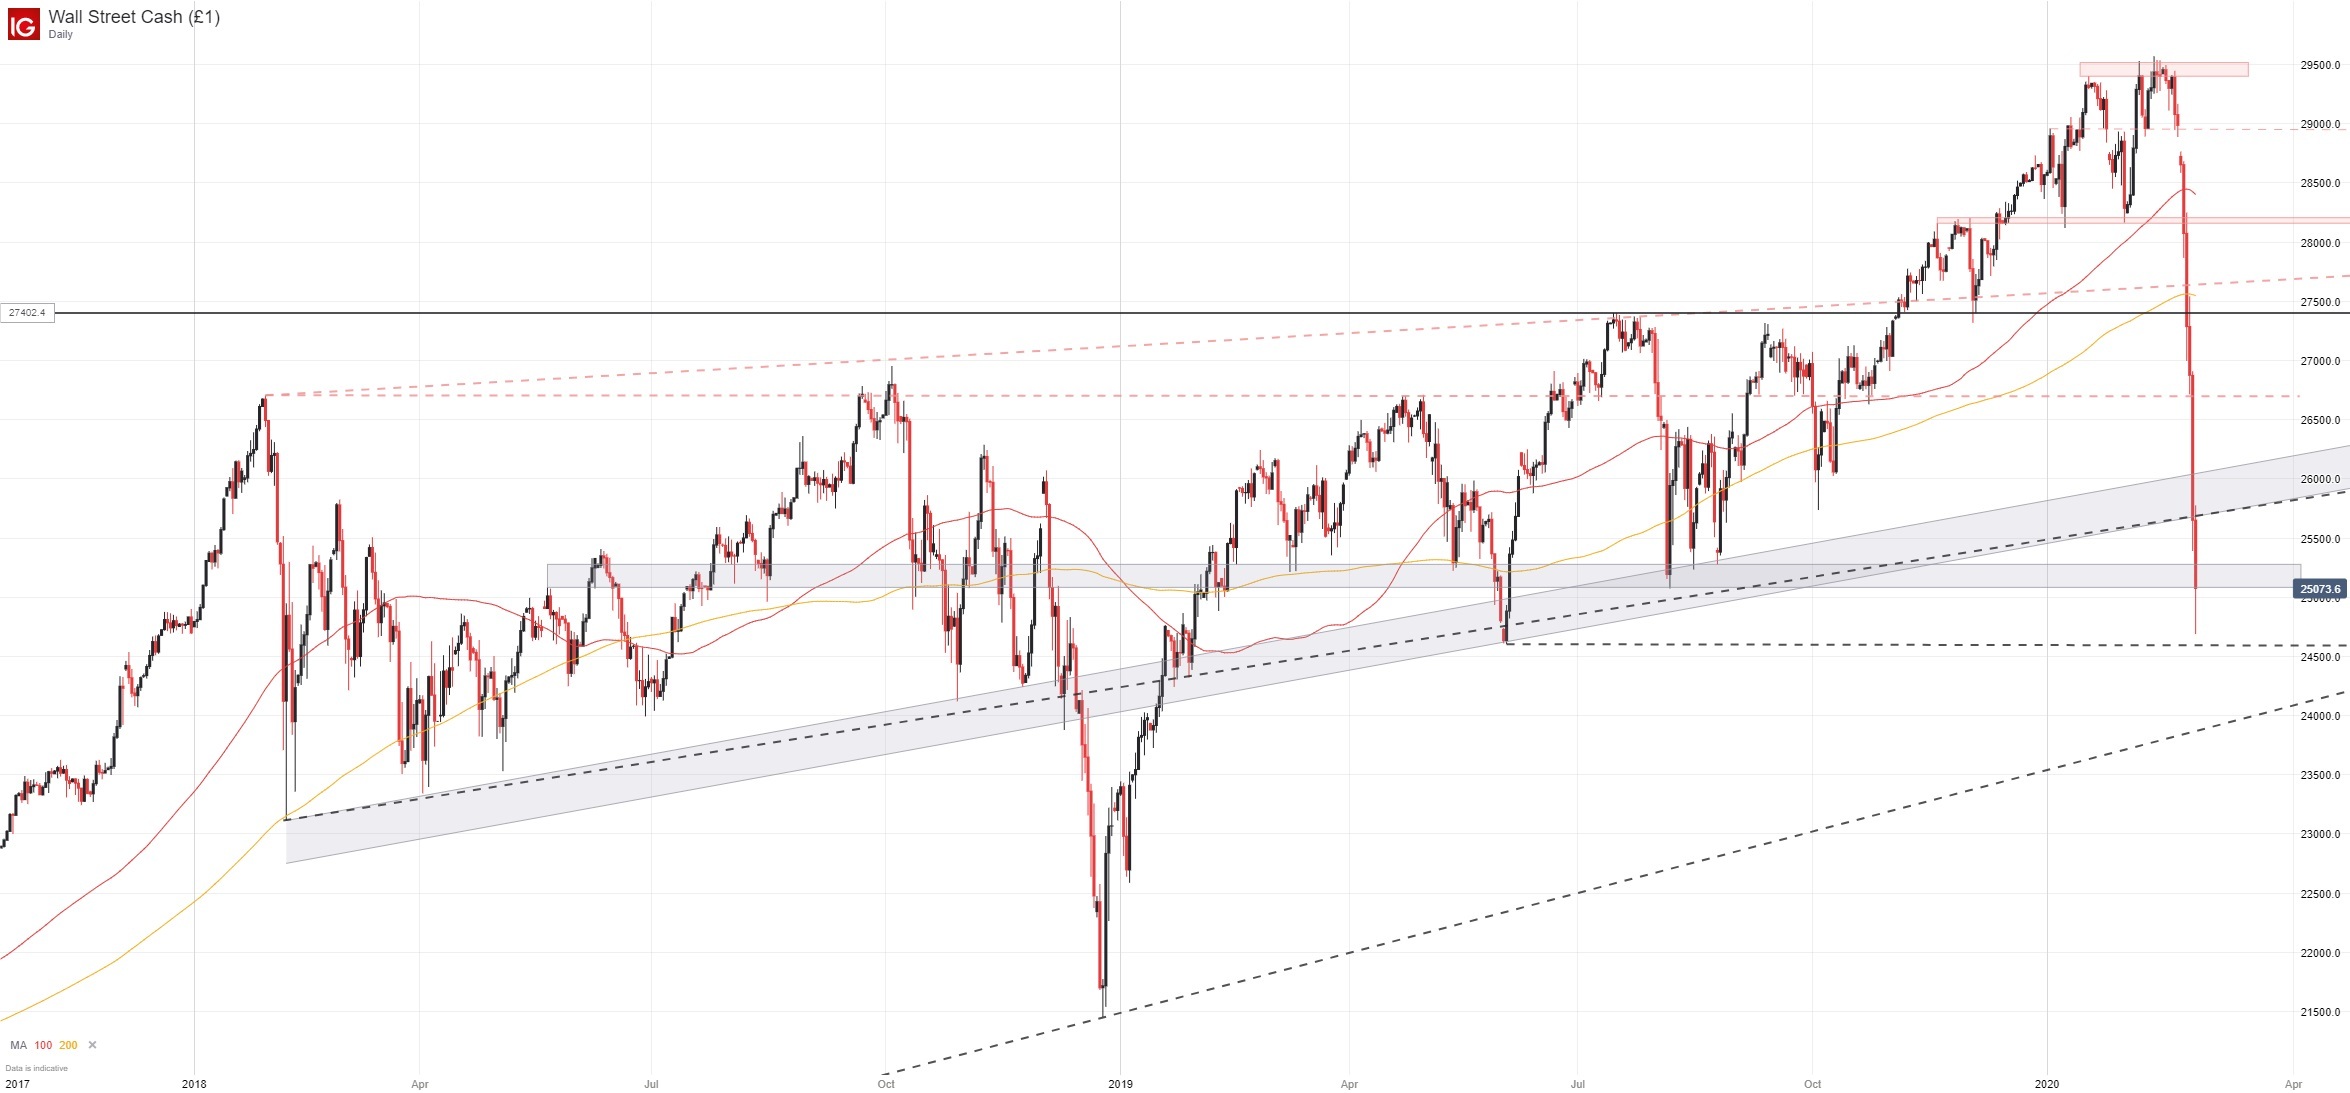
On pace for their worst weekly performances since 2008, the Dow Jones, Nasdaq and S&P 500 are edging ever closer to a technical bear market which stands just 6% away from current levels. Given the pace of declines, probing bear market territory is not out of the question as uncertainty still reigns.
Dow Jones Price Chart: Daily Time Frame (November 2017 – February 2020)
That being said, gold and silver suffered drastic declines on Friday, posting their largest daily losses since 2013 and 2016 respectively. While the moves could be attributed to waning risk aversion, they may also be indicative of a rotation into cash which could suggest outright panic – a theme that would coincide with the Dow’s cavernous declines early in the session.
Either way, clinging to one assumption would be rather presumptuous at this time given the historic levels of declines and volatility. Therefore, waiting for further clarity may be the most prudent strategy before succumbing to FOMO. If stocks can catch their footing and the precious metals continue lower, the divergent performances could be an early sign the worst has passed. Price action in US Treasuries and safe haven currencies may also help shed light on the equation.
In the meantime, follow @PeterHanksFX on Twitter for updates as the Dow Jones looks to hold above technical support derived from the August and June lows. A break beneath the latter could suggest the declines in gold and silver are more indicative of panic and a desire for cash – which may in turn beget further stock market losses.
It is also important to keep in mind Thursday’s session saw a mid-day bounce before losses accelerated in the final minutes of trading to push stocks to their daily lows just before the close, so an early bounce could easily morph into a falling knife.
--Written by Peter Hanks, Junior Analyst for DailyFX.com
Contact and follow Peter on Twitter @PeterHanksFX


