Euro Weekly Price Forecast, Analysis and Chart:
- Moving averages underscore current market weakness.
- Oversold market conditions may slow further bearish price action.
EUR/USD Price- Unloved and Eyeing Sub-1.1000
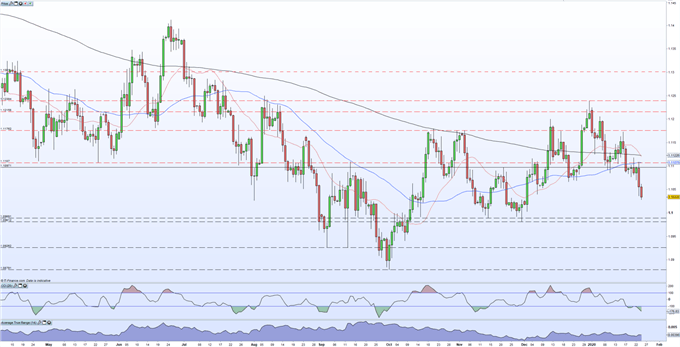
The EUR/USD sell-off from the start of the year continues with the pair hitting 1.1027 on Friday, its lowest level in nearly two months. And the chart suggests lower prices on the horizon with a break of 1.1000 opening the way to a small support zone between 1.0981 and 1.0989. The break below 1.1000 may be slowed by two-way price action around the big figure and the CCI indicator which shows that the pair are oversold in the short-term. The negative outlook is highlighted by EUR/USD trading under all three moving averages. To the upside there are several resistance levels between 1.1108 and 1.1124 which are going to need a fundamental driver if they are to be cleared.
In the longer-term, EUR/USD would need to make a fresh lower low below 1.0879 to turn further negative, something that may prove to be difficult.


EUR/USD Daily Price Chart (April 2019 – January 24, 2020)

| Change in | Longs | Shorts | OI |
| Daily | -1% | -4% | -3% |
| Weekly | 4% | -10% | -5% |
EUR/GBP Price – Upside Capped as Pattern Repeats
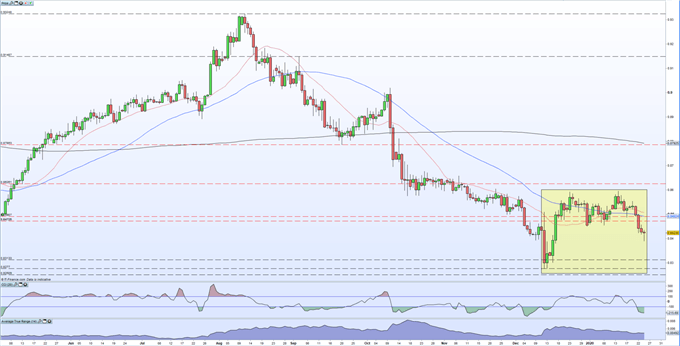
Another pair that have fallen this week on a combination of euro weakness and Sterling strength. The pair are bouncing back off today’s 0.8390 low, the lowest seen since December 17 and continue a pattern retrace off the mid-December double low. The chart shows the oversold nature of the market and narrowing trade range, but the weakness in the pair is highlighted by the strong break below the 20- and 50-day moving averages with little support of note until 0.8277 is reached. Below here we are back to levels last seen in June 2016. Any upside should find resistance either side of 0.8500 from a cluster of recent highs and lows and the two previously mentioned moving averages.
EUR/GBP Daily Price Chart (May 2019 – January 24, 2020)

Traders may be interested in two of our trading guides – Traits of Successful Traders and Top Trading Lessons – while technical analysts are likely to be interested in our latest Elliott Wave Guide.
What is your view on the Euro – bullish or bearish?? You can let us know via the form at the end of this piece or you can contact the author via Twitter @nickcawley1.


