


Indices Highlights:
- Dow Jones trend remains firmly pointed higher
- DAX working on trading into record territory
- FTSE lagging below resistance, but breakout could be near

Dow Jones trend remains firmly pointed higher
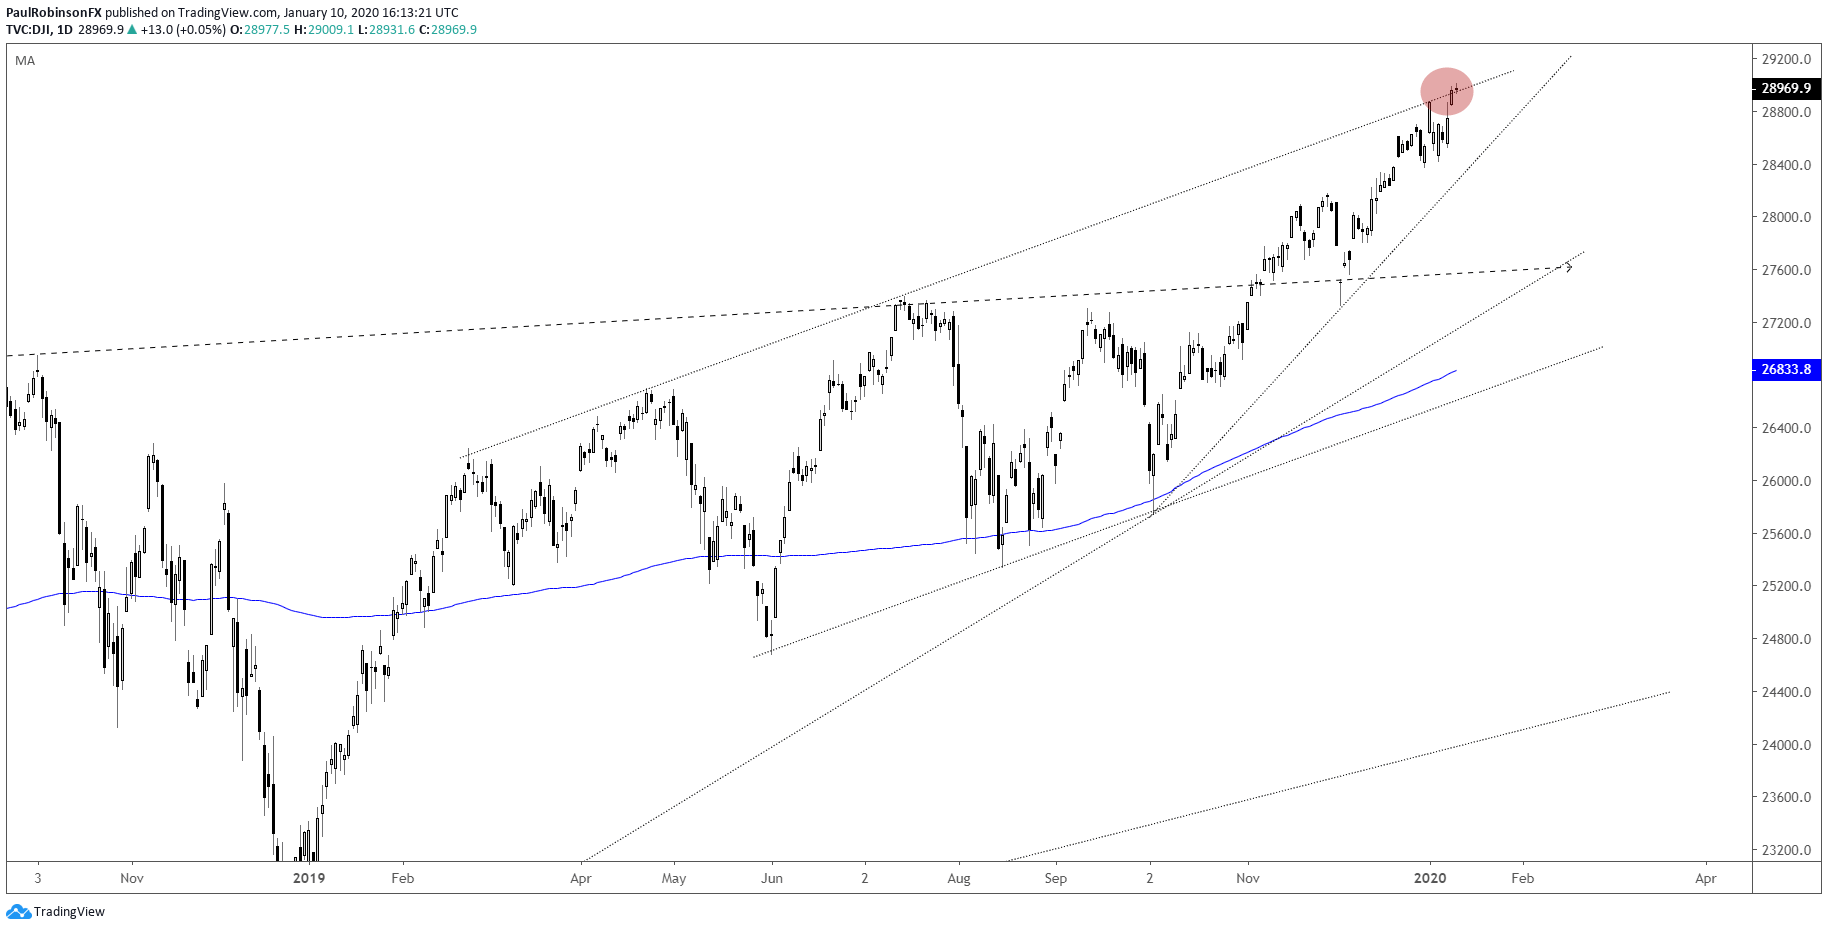
The Dow Jones is working on trying to arch itself above the top-side channel line extending higher since a peak formed back in February of last year. If it can push above, there could be room for even more acceleration in an already aggressive trend higher.
For now, risk/reward isn’t that favorable for longs, though, however it is even worse for shorts. The feeling on this end is that we continue to see some more strength in the near-term, but that could fade by months end. But until we see invasive price action, it looks prudent to continue paying respect to the power higher.
Dow Jones Daily Chart (keeps on trucking)
Dow Jones Chart by TradingView
DAX working on trading into record territory
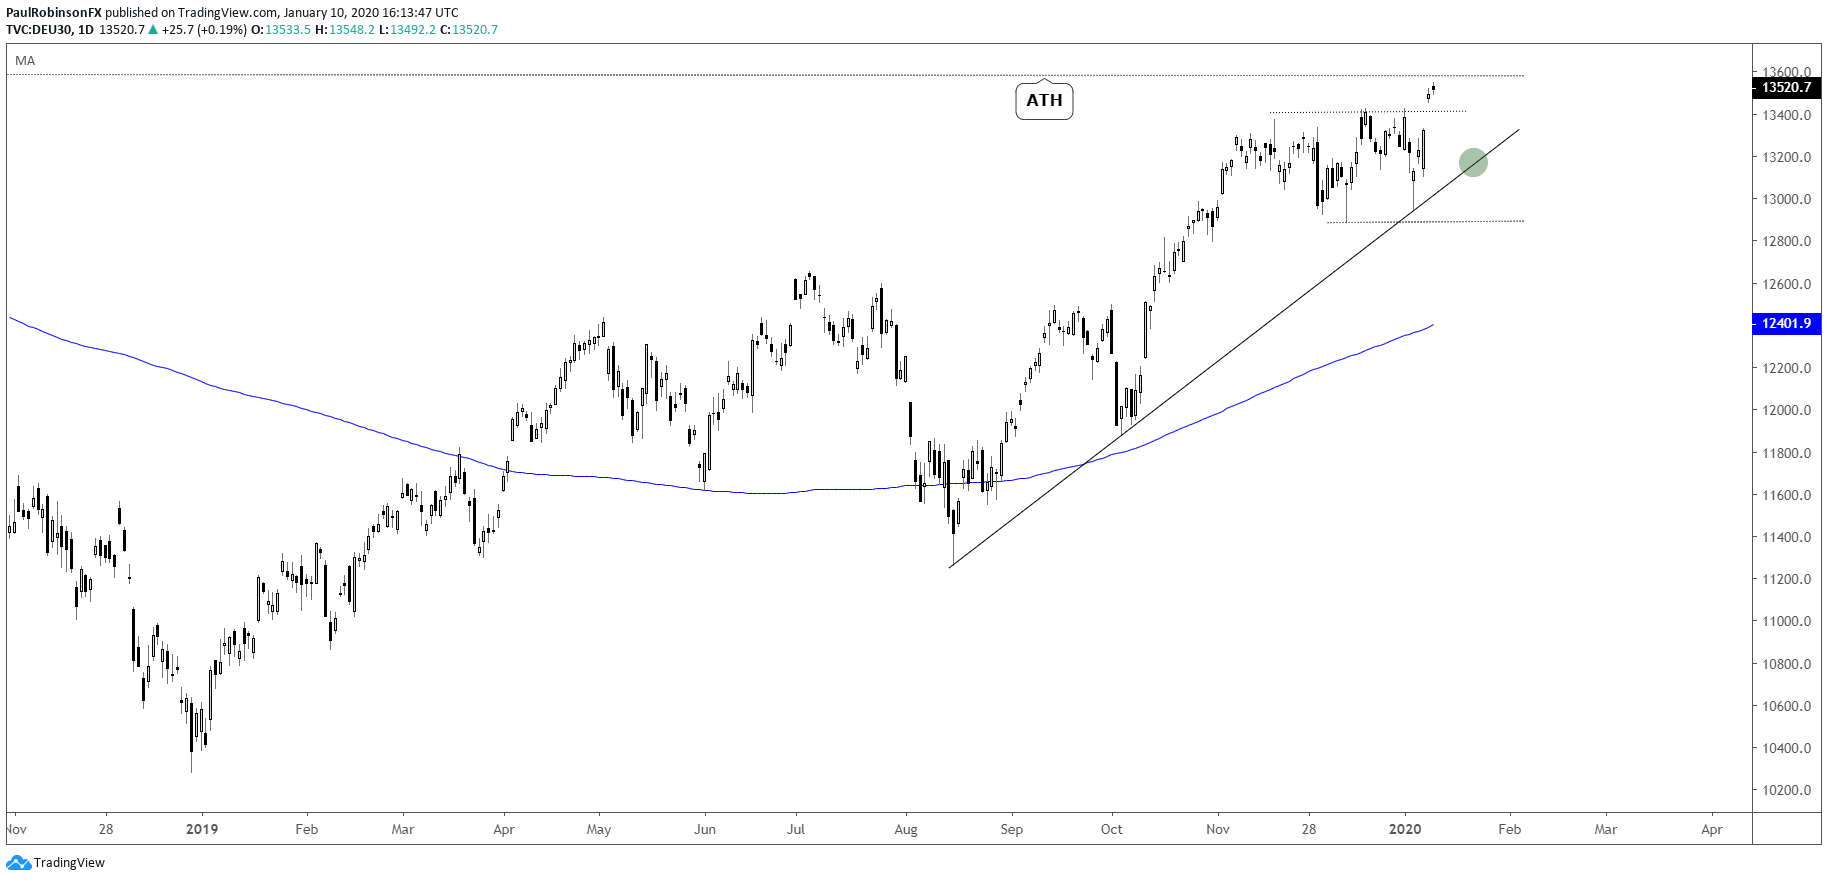
Last week the DAX advanced the ball towards new record territory not seen since the peak in 2018 at 13596. As is the case in general with global equities, it appears best to continue giving the upside the benefit of the doubt. But traders still need to be careful not to get caught chasing as risk of a pullback continues to climb on further strength. Broadly speaking, the trend-line from August, as long as it holds, will keep the market pointed higher on any dip.
DAX Daily Chart (looking for new ATHs)
FTSE lagging below resistance, but breakout could be near
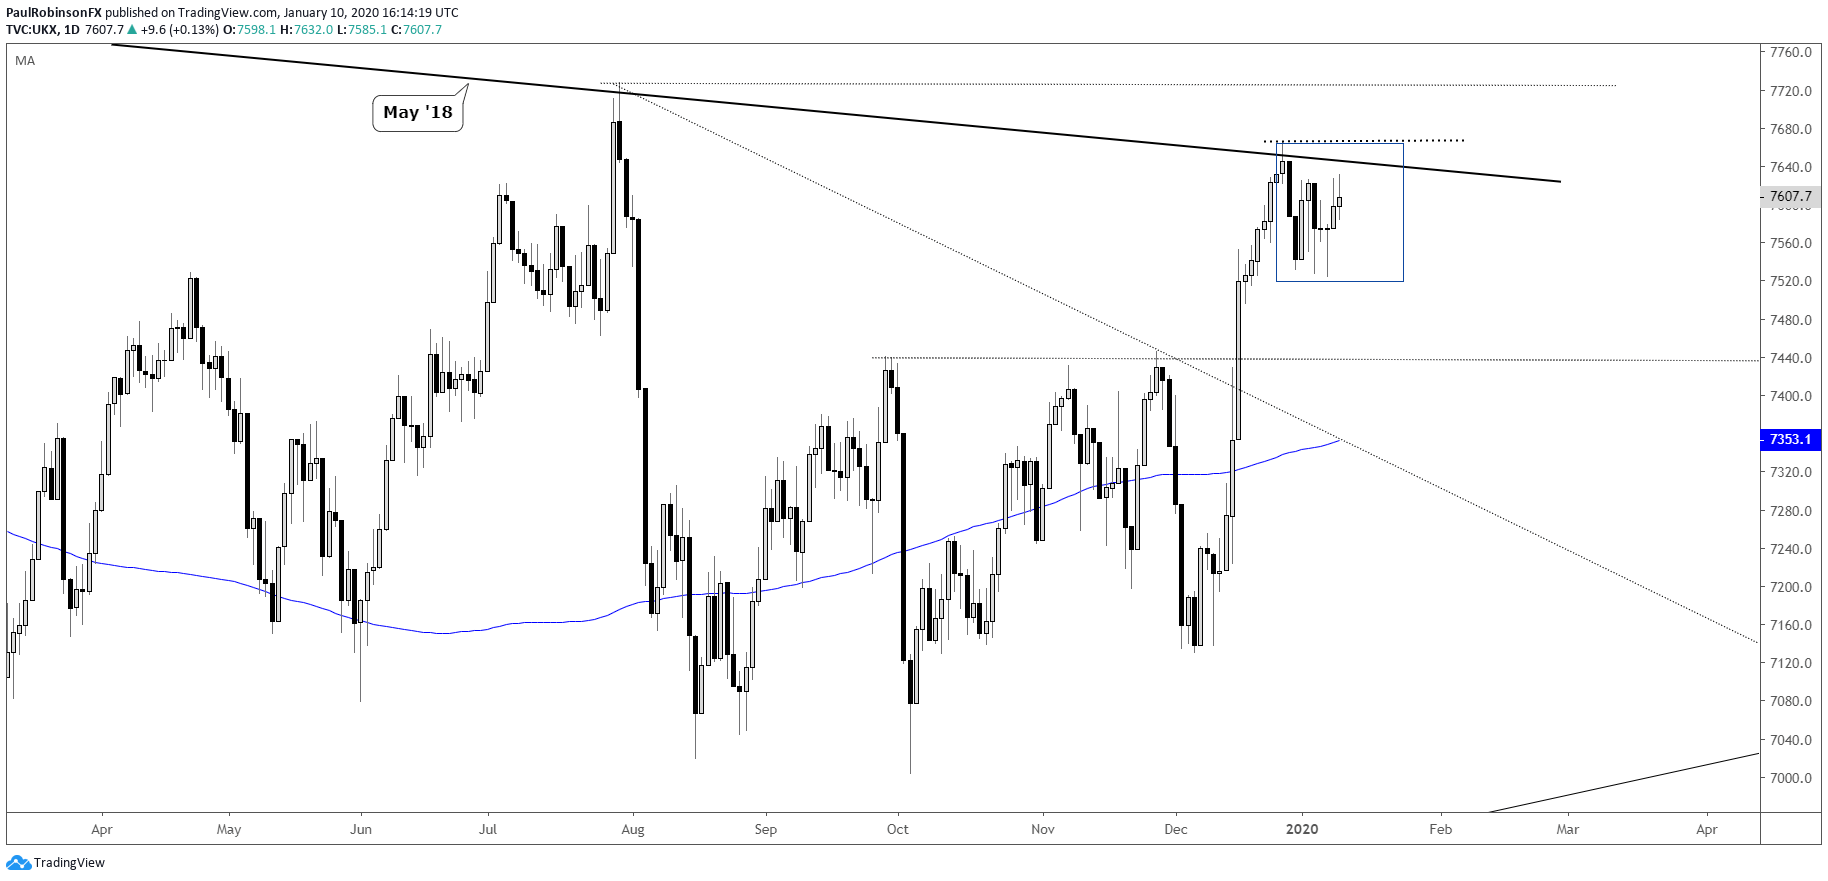
The FTSE is digesting the recent leg higher, and on that there is an obvious lag relative to other major stock markets. But even as such, this recent period is viewed as a base that will eventually lead the FTSE to higher levels once the trend-line from May 2018 is broken. To confirm a break, 7665 needs to be crossed. If it does, then look for the 2019 high at 7727 to be quickly challenged.
FTSE Daily Chart (consolidating below resistance)
UK 100 Index Chart by TradingView
Forex & CFD Trader Resources
Whether you are a new or experienced trader, we have several resources available to help you; indicator for tracking trader sentiment, quarterly trading forecasts, analytical and educational webinars held daily, trading guides to help you improve trading performance, and one specifically for those who are new to forex.
---Written by Paul Robinson, Market Analyst
You can follow Paul on Twitter at @PaulRobinsonFX


