


British Pound Technical Forecast
- High British Pound volatility anticipated in the week ahead on UK General Election
- Fading GBP momentum offers cautious technical outlook for Sterling crosses ahead
- GBP/USD, EUR/GBP, GBP/JPY and GBP/CAD make bold attempts to extend trends
Build confidence in your own British Pound strategy with the help of our free guide!
DISCLAIMER – High British Pound Volatility Expected Ahead
This past week, we have seen the British Pound pull off impressive gains against its major counterparts such as the US Dollar, Euro, Japanese Yen and Canadian Dollar. This has come on the fundamental backdrop that the UK Conservative Party can secure a majority at the upcoming general election on December 12. Such an outcome increases the odds of passing Prime Minister Boris Johnson’s Brexit deal, lowering uncertainty.
Until the result of the vote is known, heightened price action is anticipated. One-week implied volatility in GBP/USD, EUR/GBP, GBP/JPY and GBP/CAD are at the highest since October. These levels were also on average last seen around the time of the 2016 Brexit Referendum. As such, traders ought to take Sterling technical analysis for the week ahead with a grain of salt against this unpredictable environment.
Forupdates on the British Pound this week, including on the election, follow me on twitter here @ddubrovskyFX.
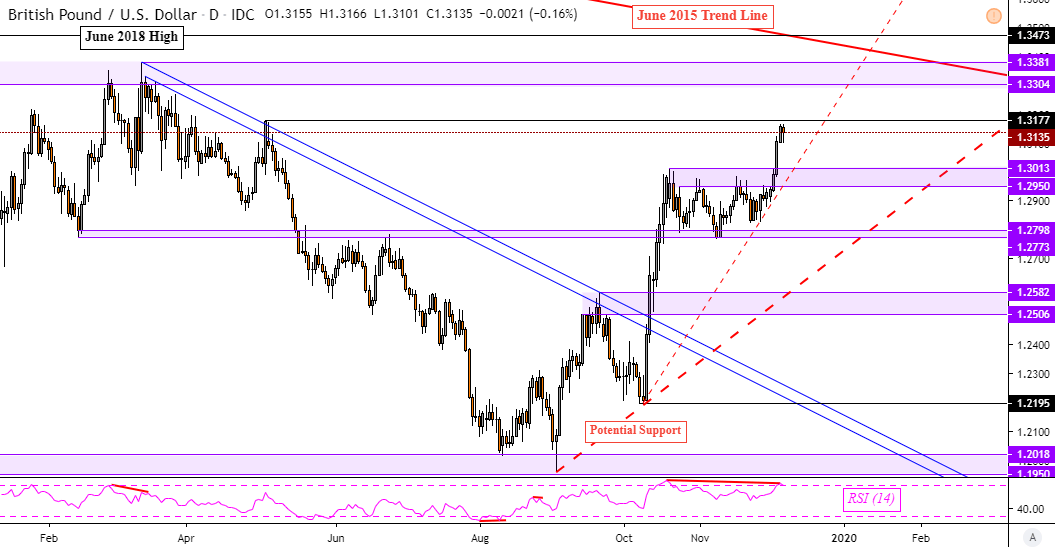
GBP/USD Technical Outlook
GBP/USD soared past the key resistance range (1.2950 – 1.3013) over the past 5 trading days, extending the uptrend from September’s bottom. This could set the stage for further gains towards a falling trend line from June 2015. Prices have paused their ascent under the May high at 1.3177 with negative RSI divergence, showing fading upside momentum. A daily close above this exposes March highs. Otherwise, a turn lower puts the focus on former support at 1.2773 and then a potential trend line from September.
GBP/USD Daily Chart
EUR/GBP Technical Outlook
The EUR/GBP has extended its dominant downtrend from July’s peak. The pair took out key support which is a range between 0.8472 and 0.8529. That has exposed the psychological barrier at 0.8300 to 0.8337 which was a floor established back in 2016/2017. This area stands between it and the former high from April 2016 at 0.8117. Here we do have the presence of positive RSI divergence, showing fading downside momentum. A turn higher could place the focus on a potential falling trend line from August.
EUR/GBP Daily Chart

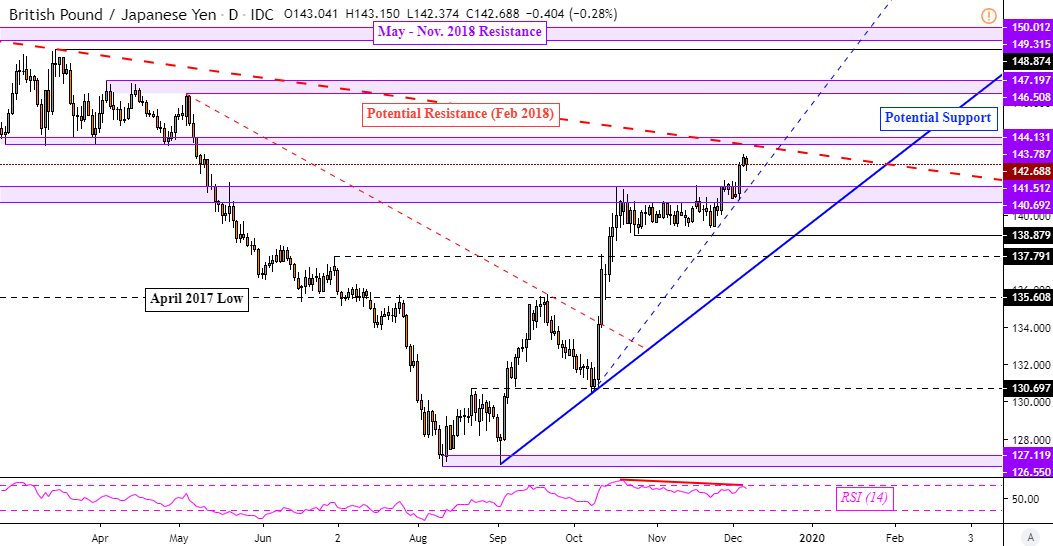
GBP/JPYTechnical Outlook
Against the Japanese Yen, the British Pound has also extended its uptrend. Key resistance was taken out (140.69 – 141.51). That has exposed a potential descending trend line from February 2018 which could keep the defining downtrend intact since then. Negative RSI divergence persists here which can at times precede a turn lower or translate into consolidation. Pushing through 144.13 exposes highs from March, April and May. Should GBP/JPY fall instead, keep an eye on potential rising support from September.
GBP/JPY Daily Chart
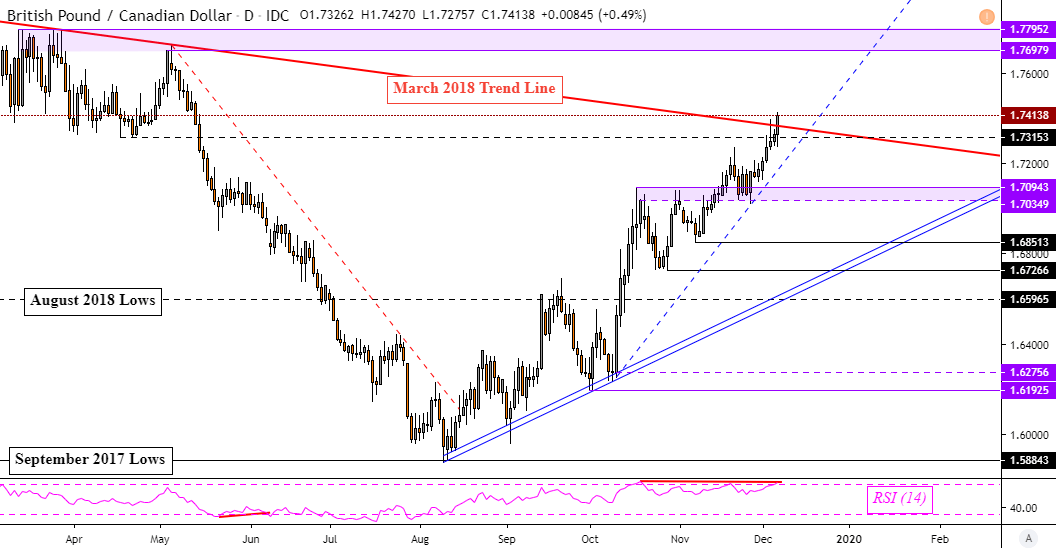
GBP/CADTechnical Outlook
The British Pound rose against the Canadian Dollar as well, with GBP/CAD taking out a falling trend line from March 2018. This has opened the door to overturning the long-term downtrend should prices find momentum to reach highs from April and March (1.7697 – 1.7795). Still, negative RSI divergence is present here which indicates fading upside momentum. A turn lower could pave the way for a revisit of former resistance which may stand in the way as support (1.7034 – 1.7094).
Join me each week on Wednesdays at 01:00 GMT where I will be taking a look at how you can use IG Client sentiment as a third element in market analysis.
GBP/CAD Daily Chart
FX Trading Resources
- Having trouble with your strategy? Here’s the #1 mistake that traders make
- See how the British Pound is viewed by the trading community at the DailyFX Sentiment Page
- Just getting started? See our beginners’ guide for FX traders
--- Written by Daniel Dubrovsky, Currency Analyst for DailyFX.com
To contact Daniel, use the comments section below or @ddubrovskyFX on Twitter


