


Euro Technical Forecast Talking Points
- EUR/USD downtrend looks to its next test as it eyes April 2017 lows
- EUR/JPY descent continues, guided by falling resistance from April
- EUR/GBP could be on the verge of staging a reversal to the upside
Trade all the major global economic data live as it populates in the economic calendar and follow the live coverage for key events listed in the DailyFX Webinars. We’d love to have you along.
EUR/USD Chart Outlook
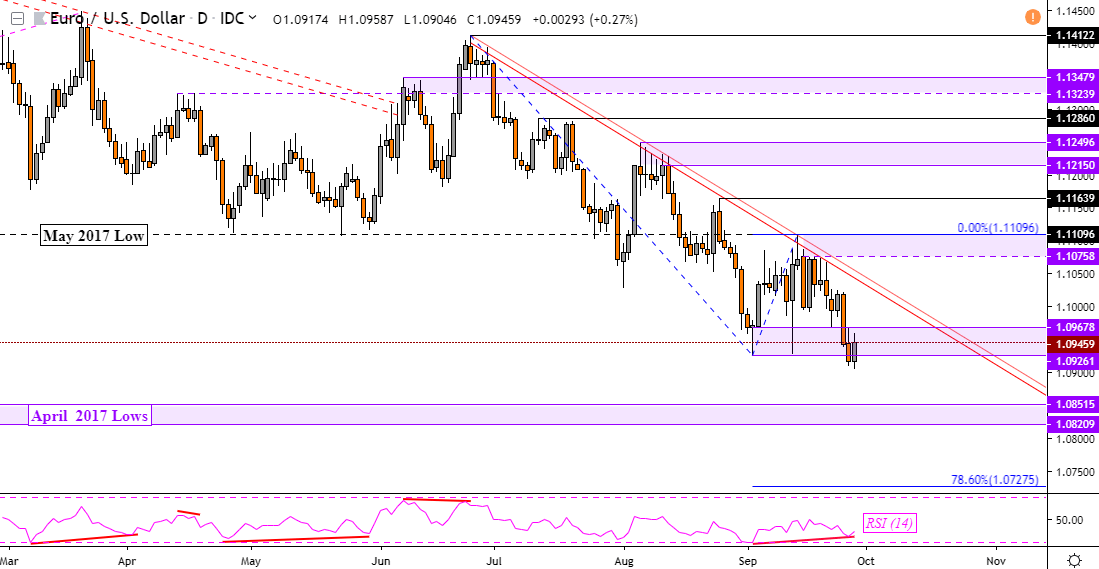
The Euro accelerated its losses against the US Dollar this past week, attempting to once again breach key support in order to resume the dominant downtrend since June. This is a key psychological barrier between 1.0926 and 1.0968, taking it out would open the door to testing lows last seen back in April 2017. As anticipated however, fading downside momentum seemed to help prevent a daily close under key support.
This is reflected as positive RSI divergence on the EUR/USD daily chart, at times this can lead to a reversal or translate into consolidation. Still, the Euro’s struggle to break through support has not yet signaled an imminent reversal risk. That would likely occur if the pair manages to breach the falling channel of resistance from June – red parallel lines below. The next test after that would be to take out the September high at 1.1109.
For timely updates on the Euro technical outlook, follow me on Twitter here @ddubrovskyFX
EUR/USD Daily Chart
EUR/JPY Chart Outlook
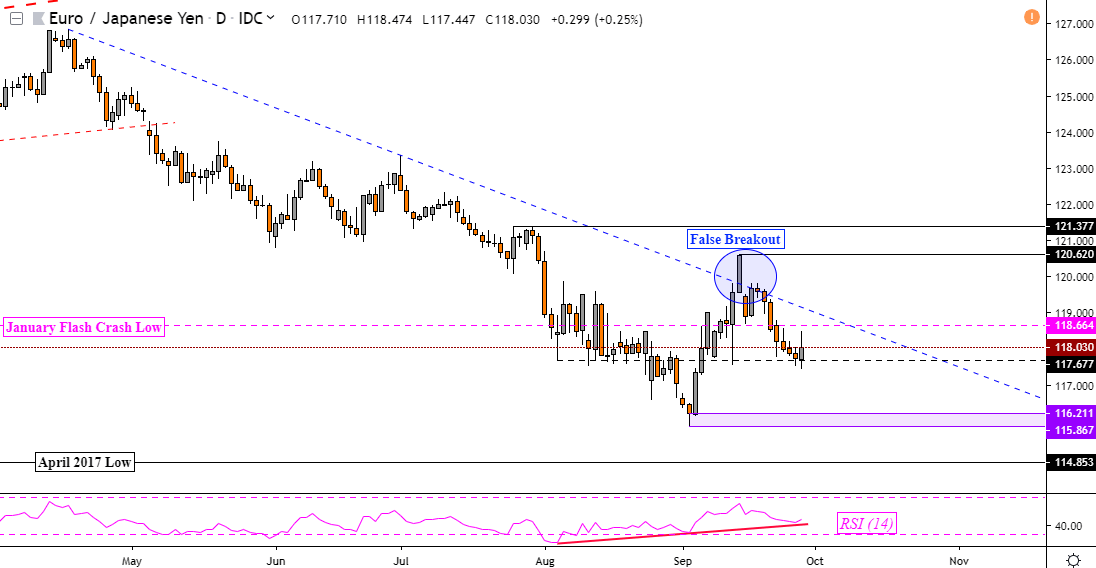
The Euro also succumbed to selling pressure against the anti-risk Japanese Yen. This is in line with the dominant EUR/JPY downtrend since April which has been kept intact by falling resistance – blue line below. Earlier in September, prices attempted to breach the trend line. But that turned out to be a false breakout as resistance was established at 120.62.
For the time being, prices paused their descent right on near-term support at 117.68. Immediate resistance is a combination of the January “flash-crash” low at 118.67 and the descending trend line. A close above these would open the door for retesting 120.60 if positive RSI divergence here also precedes a turnaround. Otherwise, resuming losses exposes the September lows between 116.21 to 115.57.
Join me every week on Wednesday’s at 00:00 GMT to learn how to use market positioning as another tool in your trading strategy!
EUR/JPY Daily Chart
EUR/GBP Chart Outlook
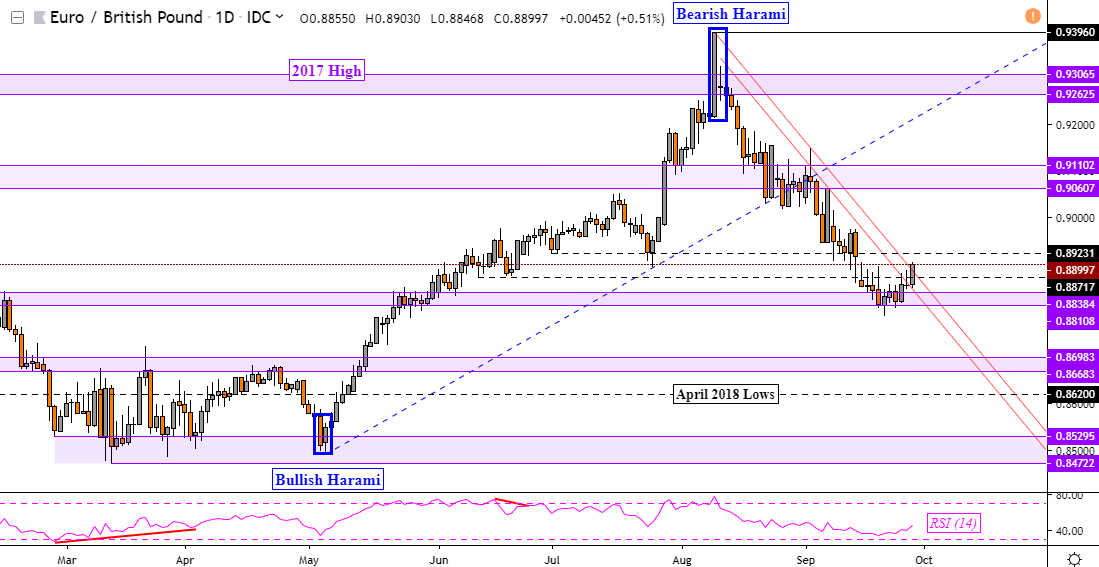
Against the British Pound however, the Euro managed to sustain gains this past week. In fact, EUR/GBP could be on the verge of staging a reversal. Since August, the Euro has dropped about 5.40 percent against the British Pound. Its descent was helped triggered by a Bearish Harami at the August peak which was then followed by a break of rising support from May.
Now, EUR/GBP has closed just above descending resistance from the August high – red parallel lines below. Confirming a daily close above near-term resistance at 0.8923 could be the door to testing the next psychological barrier between 0.9061 and 0.9110. Otherwise, resuming the dominant downtrend entails taking out support which is a range between 0.8838 and 0.8811.
Check out the DailyFX Economic Calendar to stay updated on fundamental event risk for the Euro!
EUR/GBP Daily Chart
All Euro Charts Created in TradingView
FX Trading Resources
- Having trouble with your strategy? Here’s the #1 mistake that traders make
- See how the Euro is viewed by the trading community at the DailyFX Sentiment Page
- Just getting started? See our beginners’ guide for FX traders
--- Written by Daniel Dubrovsky, Currency Analyst for DailyFX.com
To contact Daniel, use the comments section below or @ddubrovskyFX on Twitter


