


Dow Jones, DAX 30, FTSE 100, Nasdaq 100 Forecast:
- The Dow Jones and Nasdaq 100 staged a nearly parabolic rebound on Friday but remain lower in the month to date
- The DAX 30 and FTSE 100 enjoyed gains of their own, but lacked the exuberance of their American counterparts
- Interested in equity markets? Sign up for the Weekly Stock Market Outlook Webinar.
Dow Jones, DAX 30, FTSE 100, Nasdaq 100 Forecasts
Stock volatility has been heightened across the various equity markets as traders continue to come to terms with conflicting fundamental themes and uncertainty. Amidst the volatility, the Dow Jones, DAX 30 and FTSE 100 have slipped beneath their longer-term trendlines from late 2018 whereas the Nasdaq remains narrowly above. In the week ahead, a continuation of Friday’s rally could see the Indices target prior support which will now look to offer resistance. Here are the levels to watch.
Dow Jones Forecast
Technical Outlook: Neutral
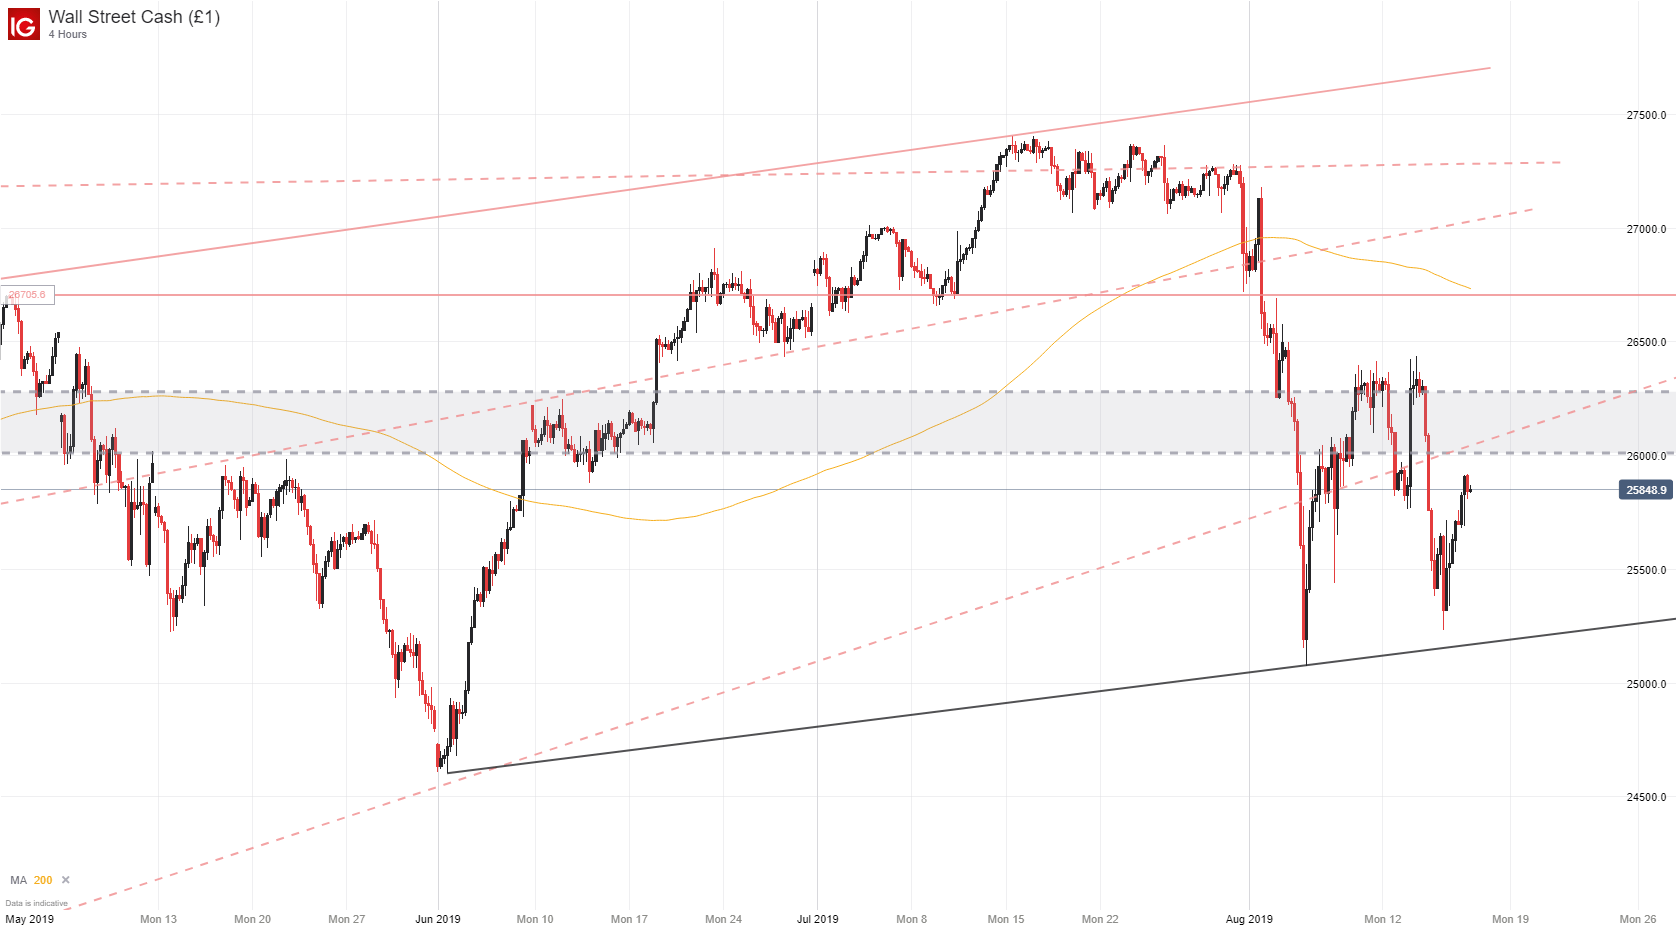
The DJIA closed Friday trading slightly beneath a band of resistance and the ascending trendline from late December 2018. If bulls can surmount the area of confluence in the week ahead, subsequent resistance may reside around 26,705 which marks the high from January 2018. On the other hand, bears will look to break the potential trendline posed by the June and August lows. If selling accelerates, June lows around 24,600 could be the final line in the sand before steeper losses.
Dow Jones Price Chart: 4 - Hour Time Frame (May – August) (Chart 1)
Nasdaq 100 Forecast
Technical Outlook: Neutral
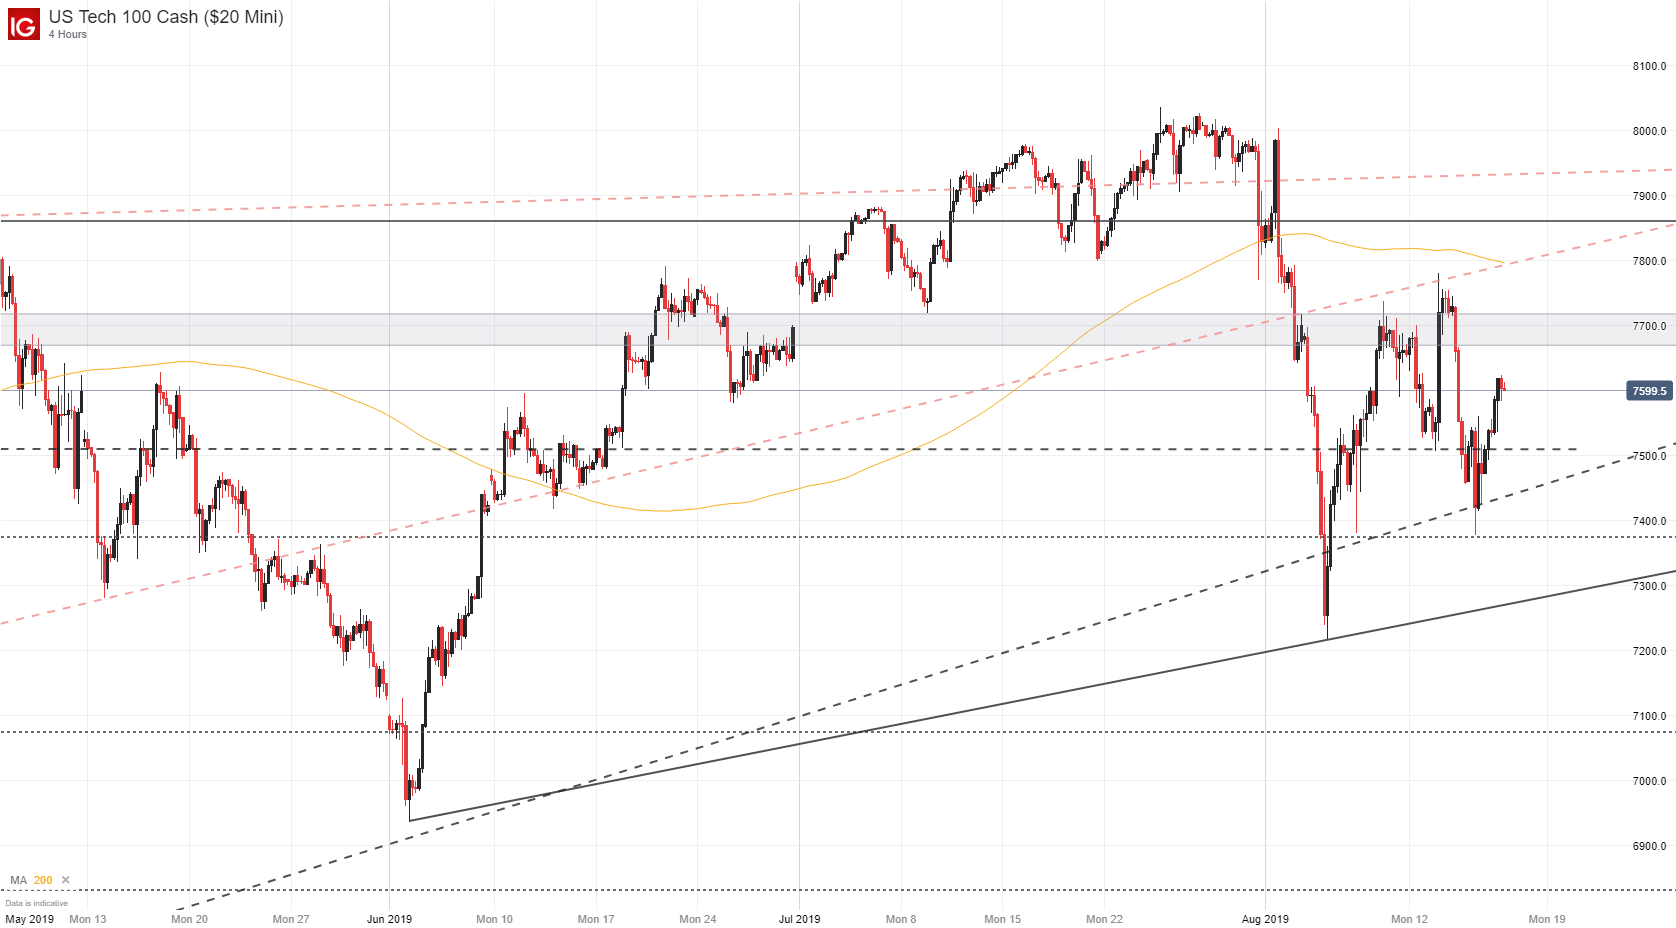
Unlike the Dow Jones, the Nasdaq was able to recapture its ascending trendline from December. It will look to provide buoyance – as will the prospective trendline from June and August lows – next week. Topside barriers may exist at 7,670 to 7,720 before the ascending trendline originating from March lows (the dotted red line above August swing highs) can become a factor. The trendline has influenced price throughout the last two quarters, most recently rebuking a move higher on August 13.
Nasdaq 100 Price Chart: 4 – Hour Time Frame (May – August) (Chart 2)
DAX 30 Forecast
Technical Outlook: Bearish
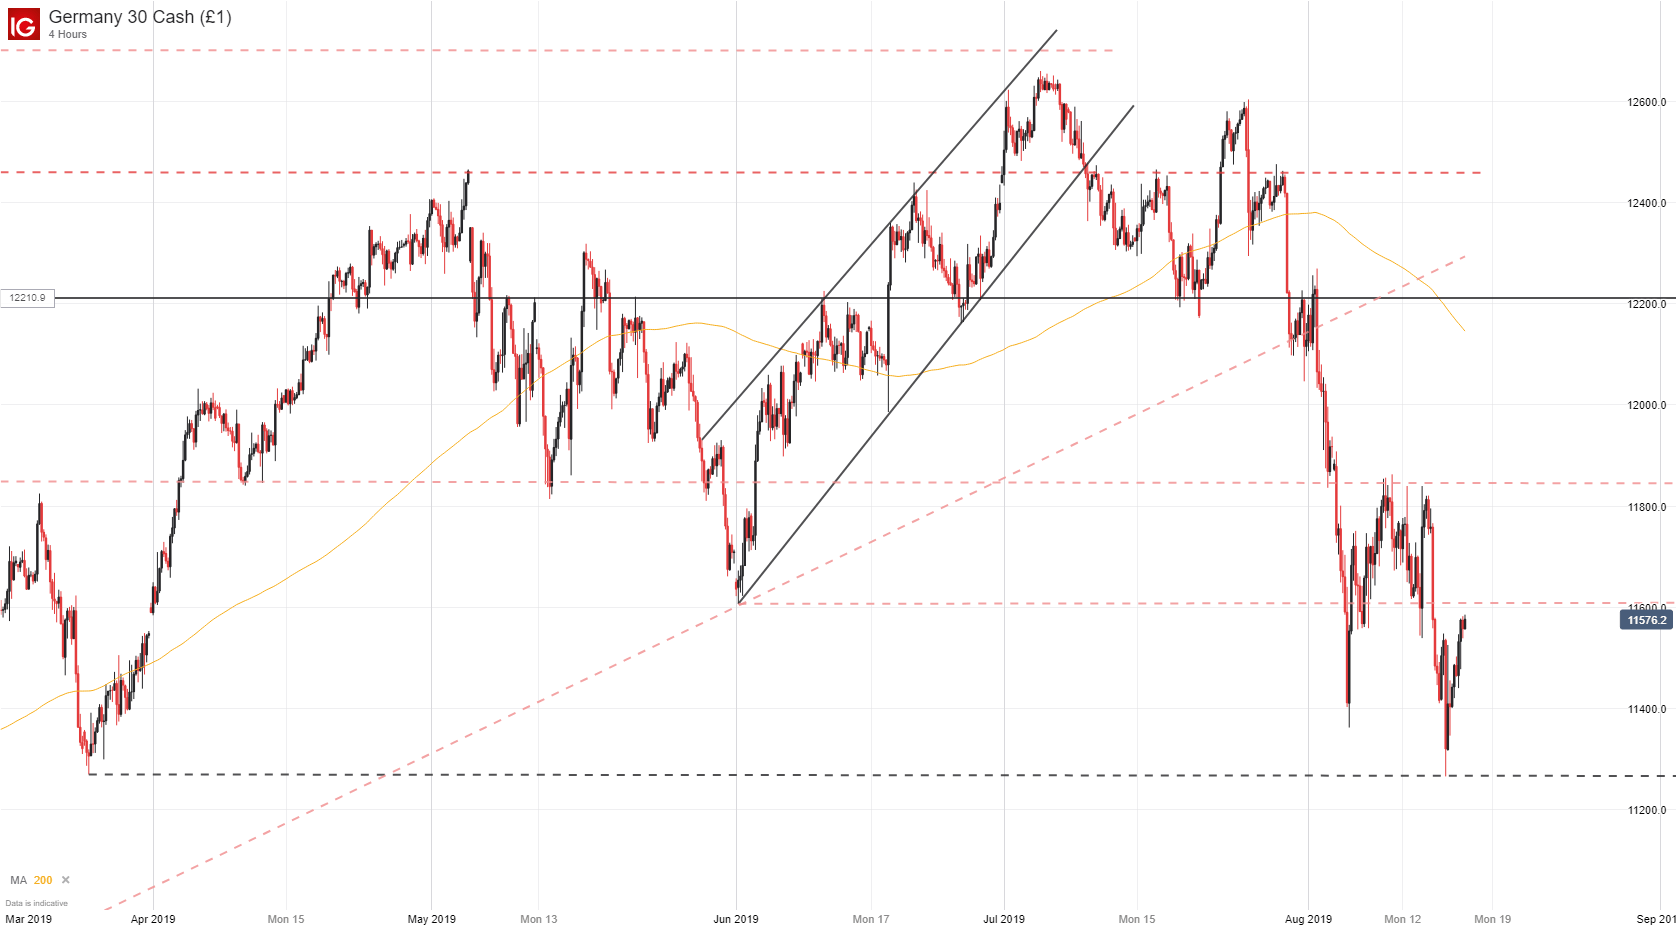
Shifting to the DAX, recent price action has not been kind to the German equity Index. Consequently, it is now well beneath the ascending trendline from December – similar to the line the Dow Jones is within reach of. If bulls return in earnest, however, two horizontal levels at 11,500 and 11,840 will look to stall a rebound before it can test the trendline near 12,200.
Interested in longer-term trades? Check out our Q3 Forecasts for equities, Gold, oil and more.
For support, the DAX is running rather shorthanded. Initial levels to watch are the August bottom – coinciding with lows from March – around 11,268. Should the lows from last week surrender to renewed bearishness, it could open the door to deeper losses down to the 11,000 area where multiple swing-lows from Q1 2018 reside.
DAX 30 Price Chart: Daily Time Frame (March – August) (Chart 3)
FTSE 100 Forecast
Technical Outlook: Bearish
Finally, the FTSE 100 finds itself in a similar situation to the DAX 30. As bulls yield to bears, price has collapsed in August with the Index roughly 600 points lower than its July high. If bears continue to drive the FTSE lower, initial support might reside near the swing lows of March and June around 7,080 – but likely only over short timeframes. Longer-term support could materialize at the psychological 7,000 level before the door is opened to probe subsequent support.
FTSE 100 Price Chart: Daily Time Frame (February – August) (Chart 4)
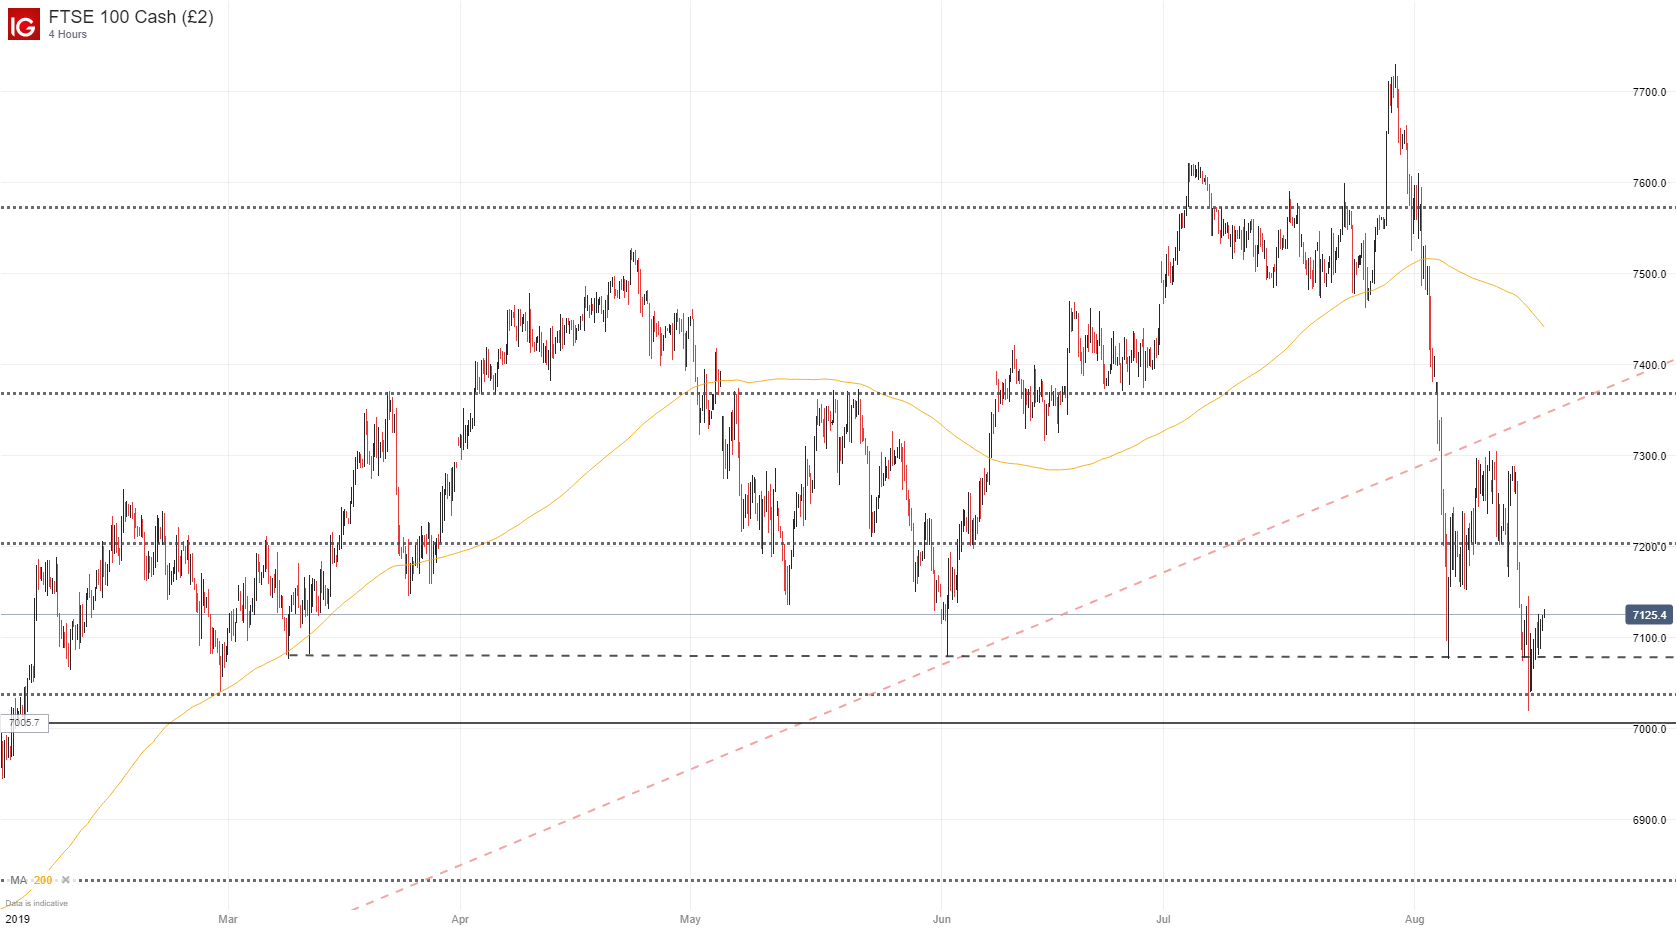
Conversely, topside barriers near 7,200 will look to stall rebounds before the Index can look to target August swing-highs around 7,300 and the ascending trendline from December at 7,365. Given that the DAX and FTSE have plunged through multiple support levels in August, it would be presumptuous to assume they have completed their descents without clear cut evidence.
To that end, the technical outlook for two European indices is bearish, while the Dow Jones and Nasdaq 100 lack a clear technical leaning in my view – resulting in a neutral bias. Follow @PeterHanksFX for updates and analysis on these themes as they progress and what it means for equity markets.
--Written by Peter Hanks, Junior Analyst for DailyFX.com
Contact and follow Peter on Twitter @PeterHanksFX
Read more: Will the Stock Market Crash in 2019?
DailyFX forecasts on a variety of currencies such as the US Dollar or the Euro are available from the DailyFX Trading Guides page. If you’re looking to improve your trading approach, check out Traits of Successful Traders. And if you’re looking for an introductory primer to the Forex market, check out our New to FX Guide.


