


- The Dow Jones slipped below the neckline on a head and shoulders pattern
- The S&P 500 gapped beneath critical support at 2,800 and grasps for support
- Similarly, the DAX 30 traded outside a key support trendline for the first time since December
- The FTSE 100 trades narrowly above a key Fib level around 7,152
Dow Jones, S&P 500, DAX 30, FTSE 100 Technical Forecast
The “Sell in May and Go Away” anomaly gained steam in the latter half of the month, as the world’s largest equity markets fell beneath key support levels. Should fundamental themes remain constant, the levels will now act as resistance if a recovery effort is staged. Here are the technical levels to watch for next week.
Dow Jones Technical Forecast: Bearish
After breaking through the neckline of a nearby head and shoulders pattern, the Dow Jones is grasping for subsequent support. The 38.2% Fib level at 24,797 looks to be the first level – but if the trend of bearish gaps continues, it will soon be invalidated. Further, the level marks the top of a gap from late January that now threatens to fill.
That said, if the 24,797 level is broken, traders could expect considerable pressure down to the 24,650 area. Beyond 24,650, two 50% Fib levels around 24,325 and 24,210 should provide some buoyancy – each marking an area of support in mid-to-late January.
Dow Jones Price Chart: 4 – Hour Time Frame (February – May)
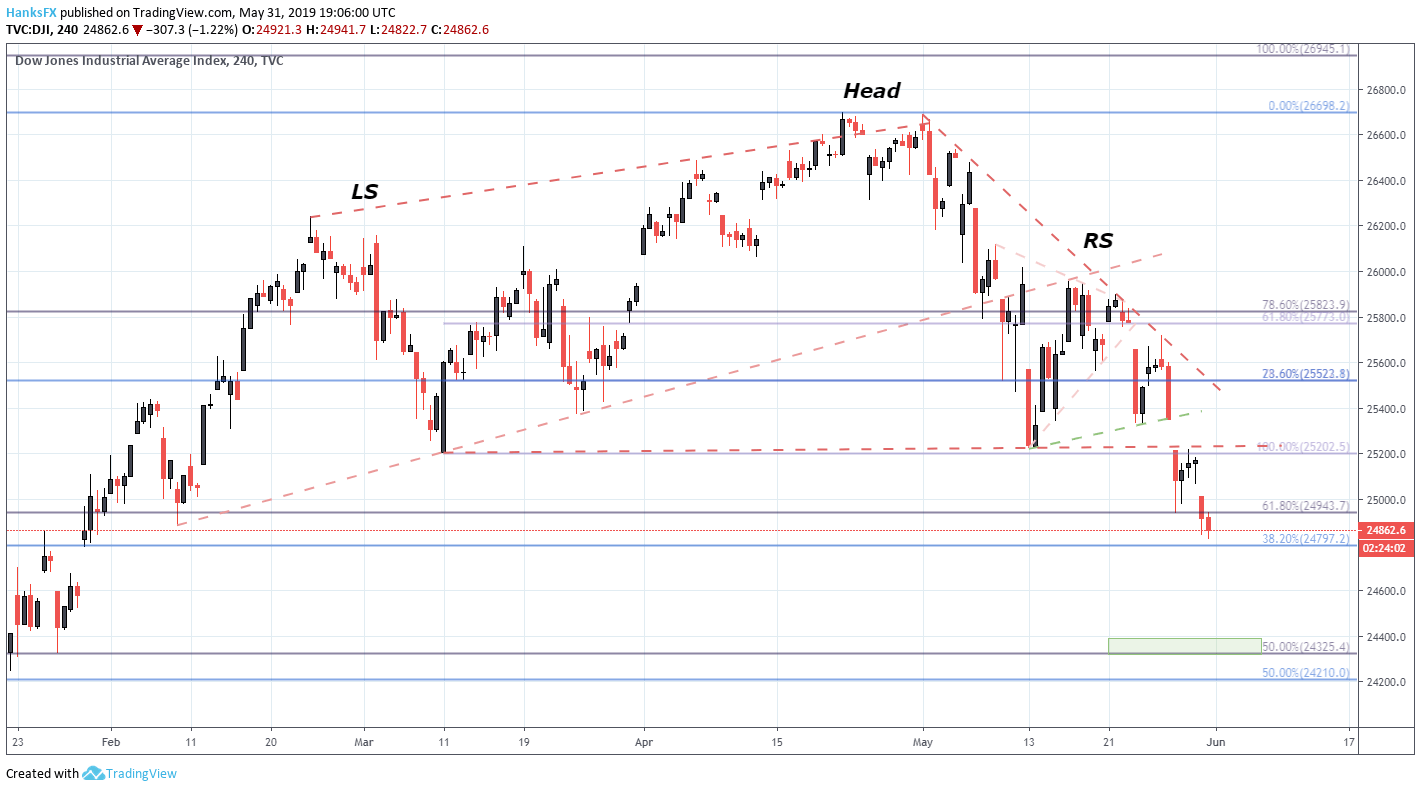
Should the Industrial Average mount a rebound, expect prior support to now pose as resistance. First and foremost, at 24,943 and the neckline around 25,200.
S&P 500 Technical Forecast: Bearish
The S&P 500 has fallen beneath critical support of its own, surrendering the 2,800 level in Wednesday trading – sparked by another opening gap lower. But unlike the Dow Jones, the S&P 500 lacks a significant area of open-air beneath, which could see further declines become more hard-fought.
Check out our Free Trading Guides for quarterly forecasts, beginner tips and more.
To that end, a confluence of Fibonacci support in the 2,715 to 2,722 range will mark the new line in the sand. Should that barrier prove insufficient, selling might gain momentum as further support becomes less clear. If breached, February’s swing-low around 2,680 will come into play.
S&P 500 Price Chart: 4 – Hour Time Frame (February – May)

To the topside, the 78.6% Fib at 2,772 and 2,800 will resist a concerted effort higher. Apart from horizontal resistance, the descending trendline from May highs could play a factor later in the week if the Index trades sideways or higher.
DAX 30 Technical Forecast: Bearish
After slipping beneath a trendline that guided the Index higher since late December, the DAX shares a similar outlook with the Dow Jones. A significantly lower open on Friday filled one gap from April, and another gap from late March may be next in line if bearishness continues.
View our Economic Calendar for upcoming data and events that may shake up the trading landscape.
With a Friday close marginally beneath the 61.8% Fib level at 11,735, the path of least resistance is lower – and minimal support is in place between the current price and the unfilled pocket. With that in mind, the Index could quickly trade to 11,546 – an area of confluence for two Fib support levels. Together, they mark the next area of noteworthy buoyancy.
DAX 30 Price Chart: 4 - Hour Time Frame (February – May)
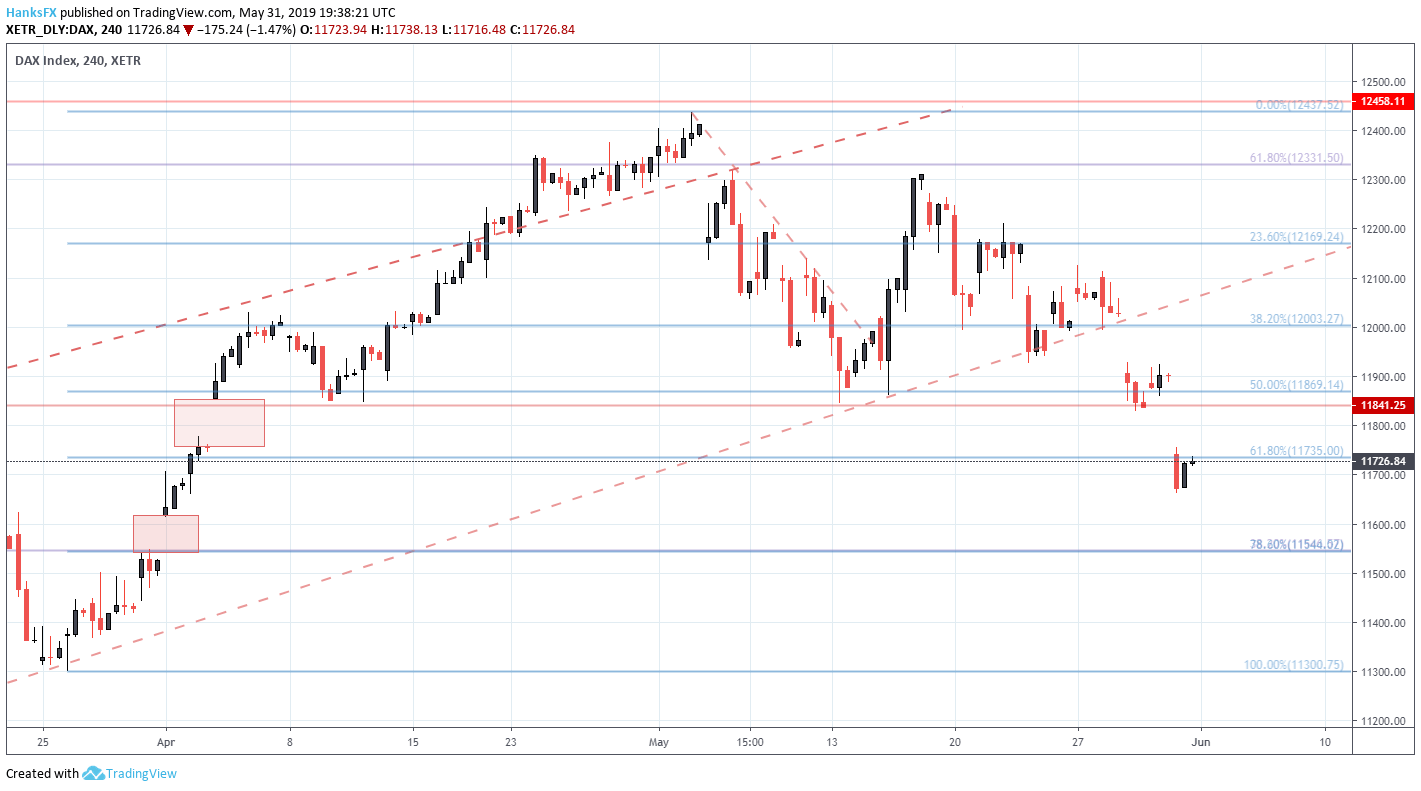
If the German Index is to press higher, it will have to reclaim horizontal resistance around 11,841. The prior support trendline will also look to stall a continuation higher, but a rebound of such magnitude seems unlikely at this time.
FTSE 100 Technical Forecast: Neutral
Conversely, the FTSE 100 was able to close Friday trading narrowly above critical support. The 38.2% Fib level at 7,152 will look to keep price afloat early next week. Should other indices break lower, the FTSE will likely be dragged with them and hope for secondary support around the lows of early March at 7,085 and the Fib levels immediately below.
FTSE 100 Price Chart: 4 – Hour Time Frame (February - May) (Chart 4)

On the other hand, the FTSE has some room to run if it looks to press higher. The first level of resistance will be marked by the 50% retracement at 7,221, followed by the support-turned-resistance trendline from December around 7,250.
--Written by Peter Hanks, Junior Analyst for DailyFX.com
Contact and follow Peter on Twitter @PeterHanksFX
Read more: S&P 500 Outlook: Investors Flee Risky Corporate Debt Amid Rout
DailyFX forecasts on a variety of currencies such as the US Dollar or the Euro are available from the DailyFX Trading Guides page. If you’re looking to improve your trading approach, check out Traits of Successful Traders. And if you’re looking for an introductory primer to the Forex market, check out our New to FX Guide.


