


Dow Jones, S&P 500 Price Outlook:
- The Dow Jones plunged beneath its 200-day moving average
- Meanwhile, the S&P 500 tested its own 200DMA after breaking below 2,800
- Retail traders are overwhelmingly short the Dow Jones and S&P 500, find out how to use IG Client Sentiment Data with one of our Live Sentiment Data Walkthroughs
Stock Market Outlook: Dow Jones and S&P 500 Selling Gains Pace
US stocks closed Wednesday trading off their daily lows, but still closed well beneath their Tuesday closing price. Like with much of May’s stock slide, first blood was drawn with an opening gap lower – this time beneath critical support for both the Dow Jones and the S&P 500.
Dow Jones Price Chart: Daily Time Frame (October 2018 – May 2019) (Chart 1)
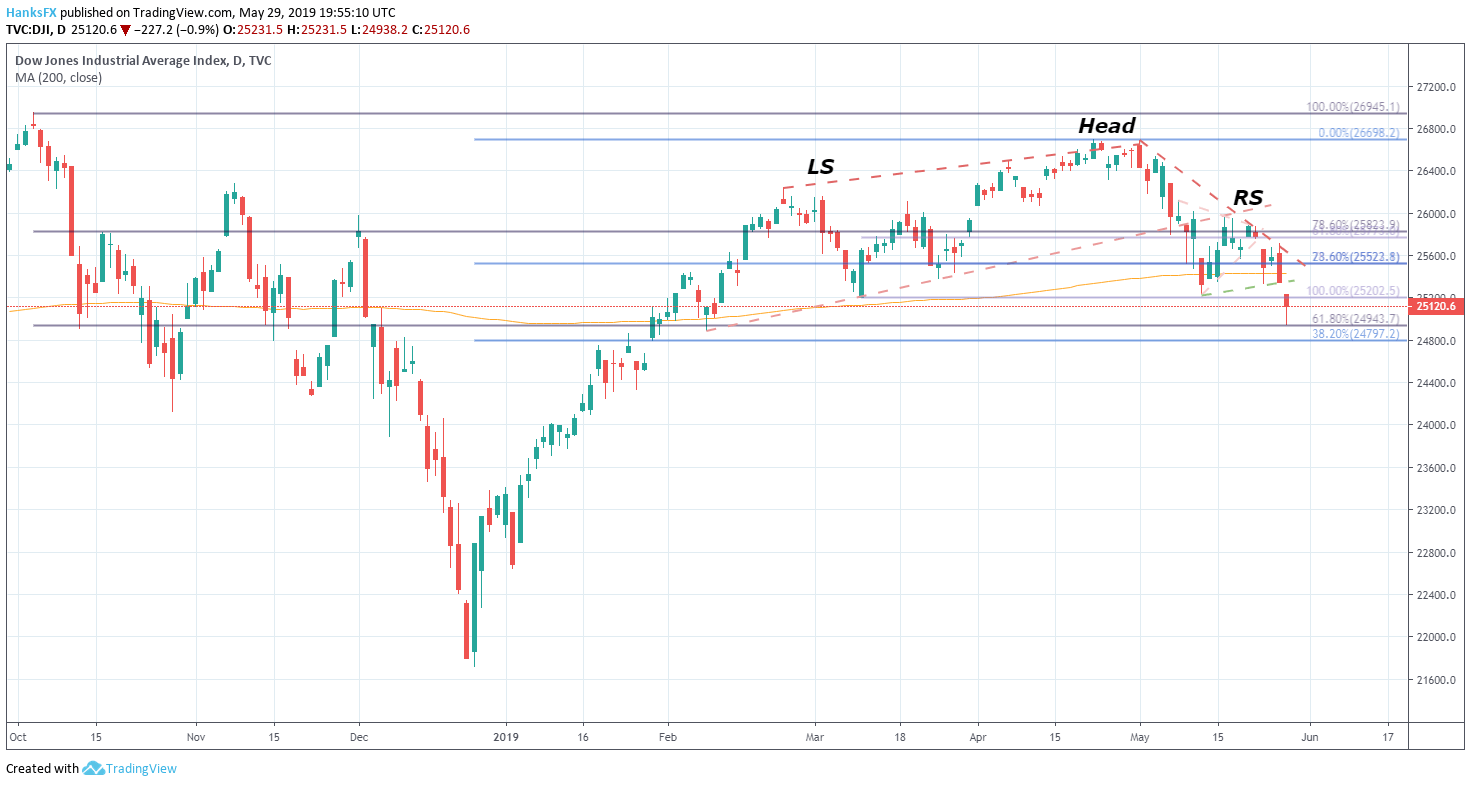
For the Dow Jones, a daily close beneath the 200-day moving average in Tuesday trading was forewarning that further selling was on the horizon. At the open, the Industrial Average gapped lower through the neckline – around 25,232 - of the head and shoulders pattern formed during the last three months. Trading lower during the session, the Dow Jones bounced off the 61.8% Fib retracement at 24,943 before crawling into the close and ending -0.87% lower.
In the days ahead, the 200-day moving average will be a key technical level to watch. Should a recovery effort surpass the average, the descending trendline from May 1 highs will look to provide subsequent resistance. To the downside, expect 24,943 to act as support once more after proving its worth in Wednesday trading.
S&P 500 Price Outlook
The S&P 500 gapped beneath critical support of its own Wednesday, opening below 2,800. The level had been a barrier to attempted moves lower earlier in May and offered price influence in February and March. With a daily close beneath, it will now serve as resistance moving forward. But perhaps more importantly, a key line in the sand has been crossed and sentiment has taken a hit.
S&P 500 Price Chart: Daily Time Frame (March 2019 – May 2019) (Chart 2)
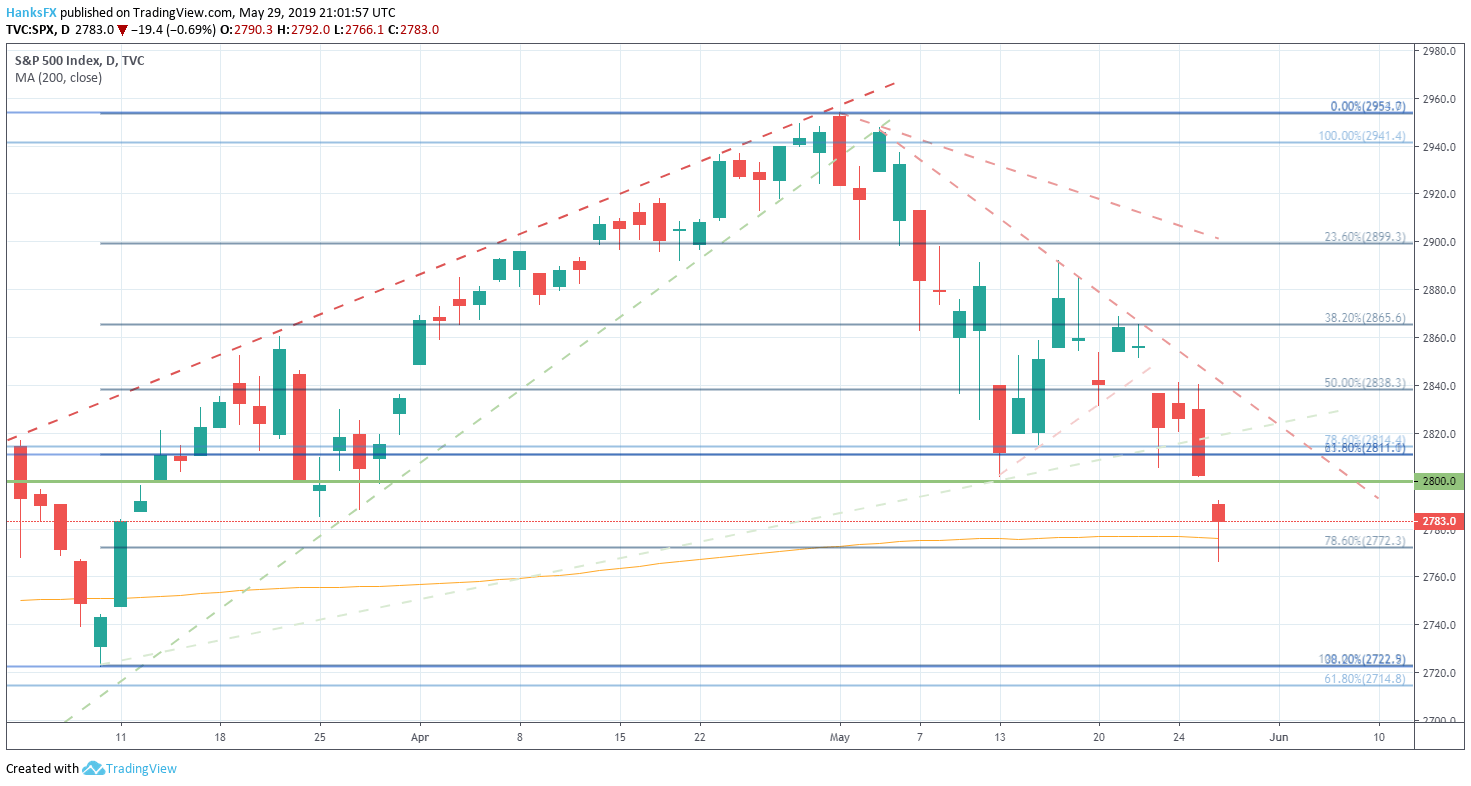
As the session progressed, the Index traded lower to test the 200DMA and the 78.6% Fib level at 2,772. Thankfully for bulls, a rebound was mounted, and the S&P 500 was able to recapture both technical levels – offering a glimmer of hope for bulls heading into Thursday trading. That said, the outlook for both indices has taken a hit with the 200-day moving average crossed or in imminent danger and a building series of lower highs and lower lows.
View our Economic Calendar for live data releases and upcoming events with macroeconomic implications.
Aside from the technical outlook, the fundamental headwinds of trade wars and slowing global growth remain at large. With China considering capping rare earth metal exports, the former may only become more dangerous. Although these concerns have lingered for months, market participants seem to be running out of optimism to combat the constant concern. Thursday trading will offer further insight on both themes with advance goods trade balance and the second print of 1Q US GDP. As these themes and unfold, follow @PeterHanksFX on Twitter for updates.
--Written by Peter Hanks, Junior Analyst for DailyFX.com
Contact and follow Peter on Twitter @PeterHanksFX
Read more: Trade Wars and Tariffs Have Put the US Auto Industry in Peril
DailyFX forecasts on a variety of currencies such as the US Dollar or the Euro are available from the DailyFX Trading Guides page. If you’re looking to improve your trading approach, check out Traits of Successful Traders. And if you’re looking for an introductory primer to the Forex market, check out our New to FX Guide.


