


Dow Jones, DAX 30 and FTSE 100 Technical Forecast:
- The Dow Jones faces considerable nearby resistance
- The DAX 30 enjoys nearby trendline support, but must surmount a Fib level to press higher
- To the delight of technical traders, the FTSE 100 will have to unravel two conflicting candlestick patterns
Dow Jones, DAX 30 and FTSE 100 Technical Forecast
Amid a whirlwind of trade war developments, equity markets across the globe had to negotiate significant volatility. After the S&P 500 posted its largest gap lower since 2009 on Monday, US equities had their work cut out for them – but were able to recoup most losses. In the days to come, equity markets will continue to struggle with the same themes. Expect technical levels to be strained, especially if volatility persists.
Dow Jones Technical Forecast: Bearish
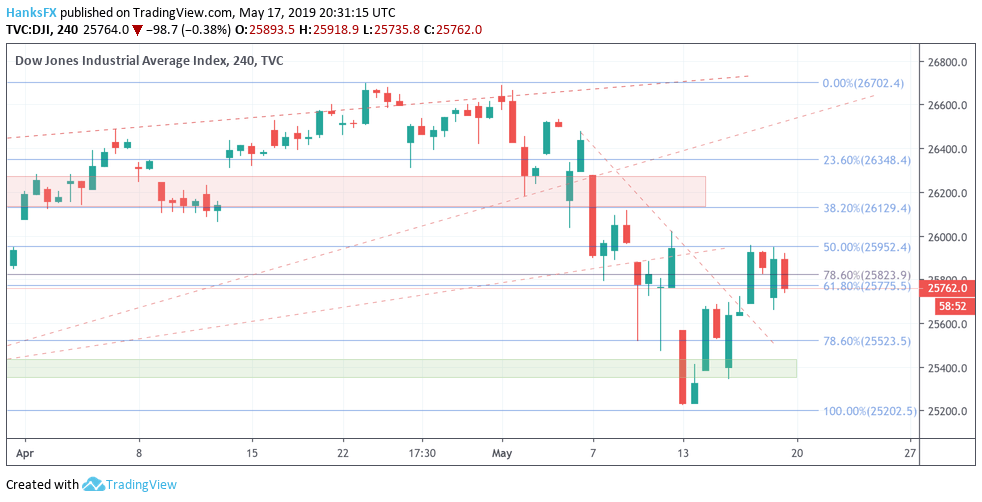
The Dow Jones ended the week marginally lower than it closed the Friday prior. More importantly however, the Index resides beneath two nearby Fib levels – the 61.8% retracement from March to May at 25,775 and the 78.6% at 23,823. Each level will look to provide resistance early next week. If those levels are surpassed, the 50% level at 25,952 will come into play. The area rebuked prices multiple times last week and should play a similar role next week.
Dow Jones Price Chart: 4 – Hour Time Frame (February – May) (Chart 1)
How to Day Trade the Dow Jones
With considerable topside resistance, the Industrial Average will once again have its work cut out for it. If attempted rallies are curtailed, the 78.6% level around 25,523 may fortify prices. Beyond that, the 25,400 area should provide further buoyance, despite a break lower on Monday. The area marks March’s lows and provided moderate support last week.
DAX 30 Technical Forecast: Bullish
After a considerable surge last week, the German DAX seems to have its sights set on a continuation rally. Luckily for bulls, the 23.6% Fib level at 12,169 and an ascending trendline from December’s low will look to provide nearby support. The trendline previously marked the lower bound of the ascending channel the Index found itself in during the first-quarter rebound. Should the support hold, the channel may become pertinent once more.
DAX Price Chart: 4 – Hour Time Frame (April – May) (Chart 2)
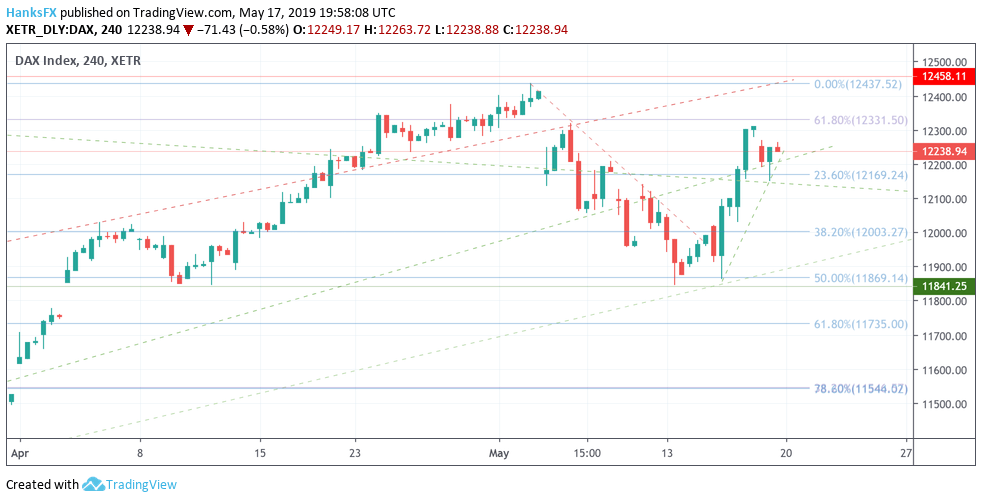
Should the index continue higher, highs from last week – around 12,300, should pose initial resistance. Secondarily, the 61.8% Fib level at 12,331 will come into play. If both those levels are surmounted, subsequent resistance will be offered by the upper-bound of the channel and at 12,437 – the full extension of the Fib level from March’s lows to May’s highs.
FTSE 100 Technical Forecast: Bullish
The FTSE 100 closed Friday’s session to leave a perfect hanging-man candlestick on the daily chart. Although shorter time frames are typically better suited for weekly forecasts, the candlestick patterns are too clear to ignore. A hanging man candlestick at the top of an uptrend generally precedes a trend reversal, but what precedes the Friday candle may carry more weight.
FTSE 100 Price Chart: Daily Time Frame (February – May) (Chart 3)
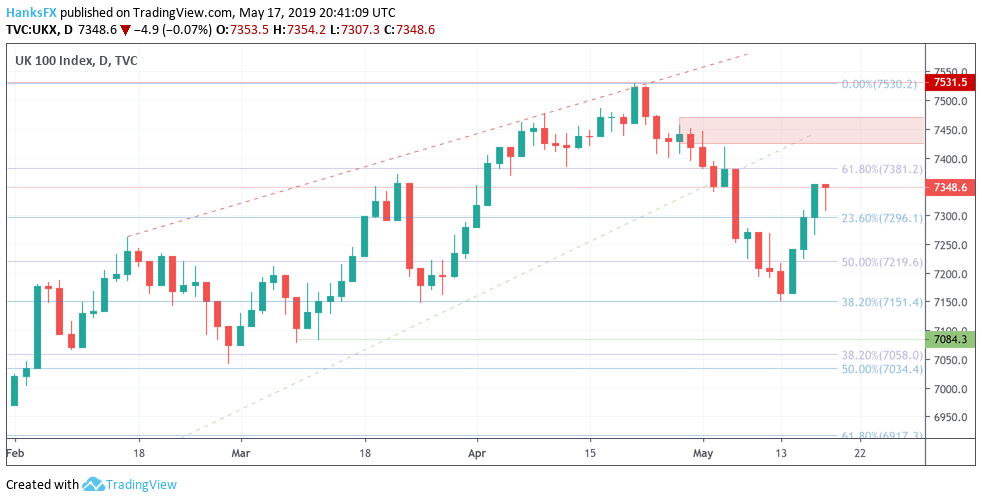
Prior to the hanging man, the candlesticks from the Tuesday through Thursday sessions form three white soldiers – in this case green soldiers. This candlestick pattern offers a bullish signal, usually preceding further gains. With the conflicting candlestick signals, technical traders will have a lot to look for next week.
That said, the most likely outcome - in my opinion – is a brief retracement early in the week to fulfil the hanging man prophecy and to consolidate. In this scenario, the 23.6% Fib level at 7,296 would pose as critical support. Once the consolidation is underway, the three white soldiers may drive the FTSE 100 higher as the week progresses. For follow up on these technical patterns, or to ask any questions, follow @PeterHanksFX on Twitter.
--Written by Peter Hanks, Junior Analyst for DailyFX.com
Contact and follow Peter on Twitter @PeterHanksFX
Read more: Gold Price Plummets, Seeks Technical Support Near May Lows
DailyFX forecasts on a variety of currencies such as the US Dollar or the Euro are available from the DailyFX Trading Guides page. If you’re looking to improve your trading approach, check out Traits of Successful Traders. And if you’re looking for an introductory primer to the Forex market, check out our New to FX Guide.
Other Weekly Technical Forecast:
Australian Forecast: Australian Dollar Targets 2009 Lows, AUD/CAD and EUR/AUD Follow?
Crude Oil Forecast: Drifting Towards Technical Support


