


Dow Jones, S&P 500, DAX 30 and FTSE 100 Technical Forecast:
- The S&P 500 and DAX 30 face important Fib levels which may give pause to a continuation higher
- The Dow Jones will look to test a trendline to the topside around 26,600
- The FTSE 100 slipped back into its ascending channel from weeks past
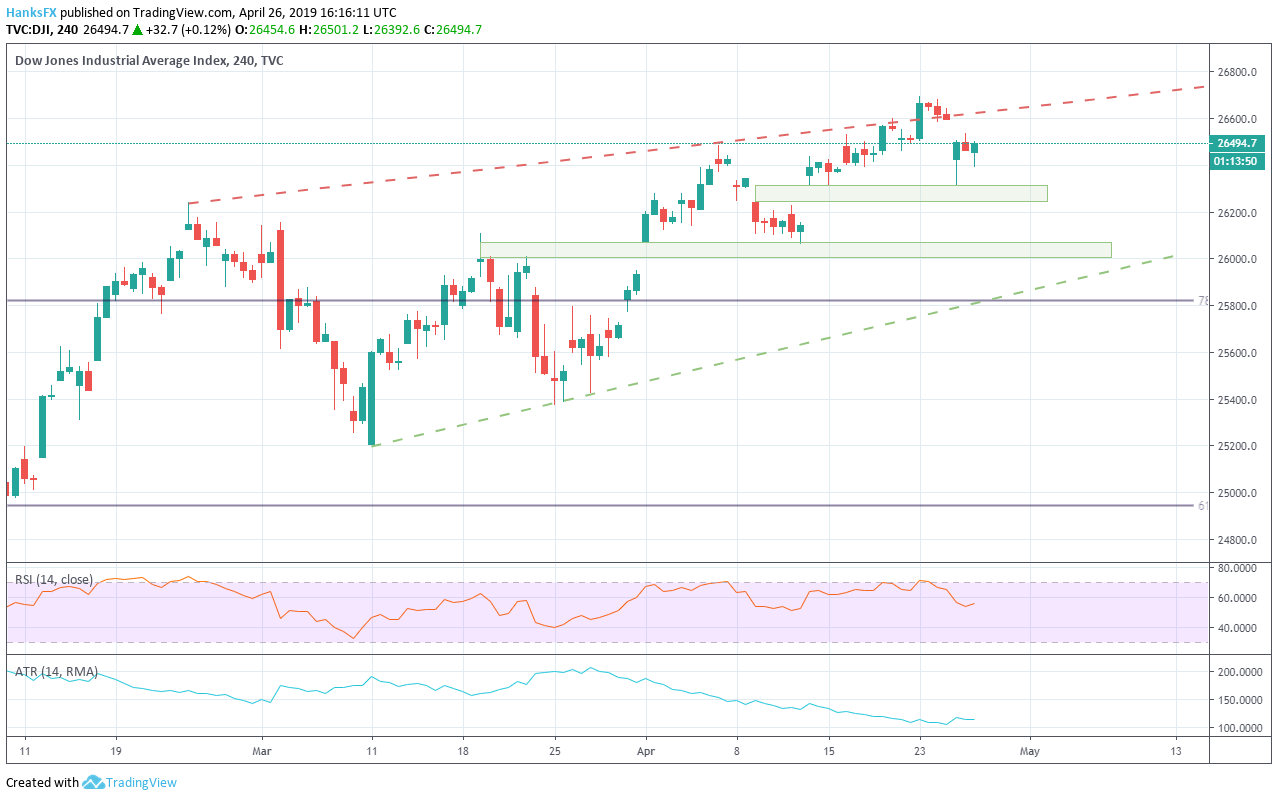
Dow Jones Technical Forecast:Bullish
After strong earnings drove the S&P 500 and Nasdaq 100 to test all-time highs, the blue-chip Dow Jones Industrial Average lagged. In the week ahead, it will look to derive influence from a topside trendline and a nearby range of support. Resistance lies slightly north of 26,600 and marks the first rough patch should the index attempt a move higher.
View our Economic Calendar for live data releases and event times in the week ahead.
Support lies underneath from 26,310 to 26,245. Should the index encounter considerable selling pressure, a secondary band of support exists at 26,070. With RSI around 55, it could be argued the Average has a more encouraging landscape compared to its S&P 500 counterpart.
Dow Jones Price Chart: 4 – Hour Time Frame (February – April) (Chart 1)
How to Day Trade the Dow Jones
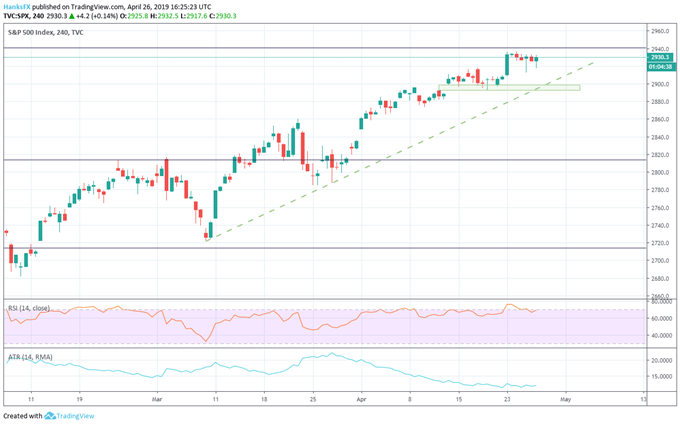
S&P 500 Technical Forecast: Neutral
The S&P 500 touched all-time highs last week but was unable to drive through the resistance they offer. That said, the Index will have to break through the 2,940 level if the melt up is to continue. Should the S&P 500 post a daily close above 2,940, topside resistance becomes uncertain as the price enters uncharted territory.
As for support, the confluence of trendline support and the 2,900 to 2,893 range will offer buoyancy. With RSI teetering on oversold territory and considerable resistance to the topside, the index might need a breather before driving higher.
S&P 500 Price Chart: 4 – Hour Time Frame (February – April) (Chart 2)
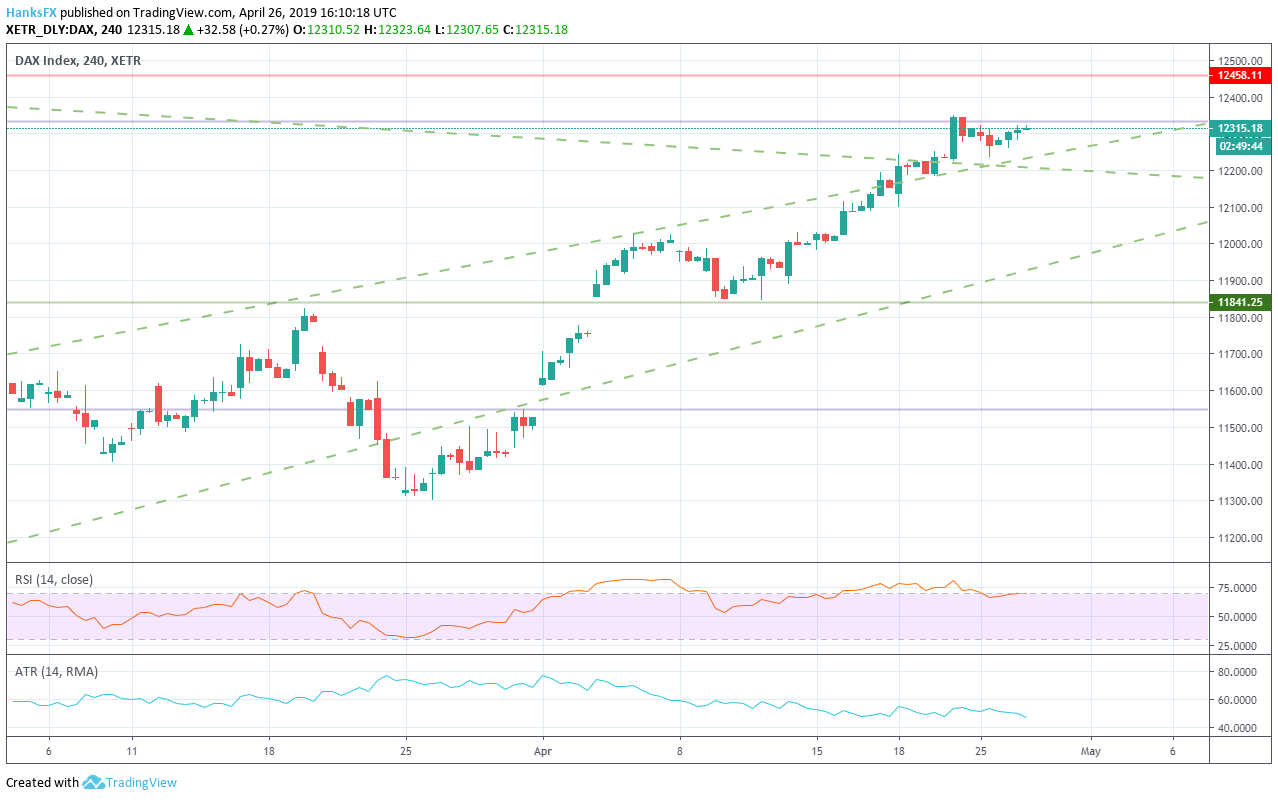
DAX 30 Technical Forecast: Neutral
Similarly, the German DAX 30 trades beneath a Fib level of its own. The 61.8% retracement from the index’s high in January 2018 to its low in December rebuffed attempted moves higher last week and will look to again in the week ahead. Should price break through, the swing-high from September may offer subsequent resistance at the 12,460 level.
That said, the DAX boasts two nearby support levels. First is the upper bound of the index’s range during its 2019 rebound, with another trendline nearby from the highs tagged in January and June of 2018. The line offered some semblance of resistance in mid-April which suggests it may act as a form of support moving forward – albeit weak.
DAX 30 Price Chart: 4 – Hour Time Frame (February – April) (Chart 3)
FTSE 100 Technical Forecast: Bullish
Unlike the DAX, the FTSE 100 retreated last week after breaking beneath a trendline from mid-February. That line – around 7,480 – may complicate an attempted rebound. The index will look to support from the 61.8% Fib at 7,382 and a trendline that has been etched out in the rebound from Christmas Eve. Prior tests of 7,382 have failed and with RSI near 45, the technical forecast for the FTSE is bullish.
FTSE 100 Price Chart: 4 – Hour Time Frame (January – April) (Chart 4)

--Written by Peter Hanks, Junior Analyst for DailyFX.com
Contact and follow Peter on Twitter @PeterHanksFX
Read more: History Suggests the Stock Market Will Climb in the Weeks After Easter
DailyFX forecasts on a variety of currencies such as the US Dollar or the Euro are available from the DailyFX Trading Guides page. If you’re looking to improve your trading approach, check out Traits of Successful Traders. And if you’re looking for an introductory primer to the Forex market, check out our New to FX Guide.


