


US Dollar (USD) Technical Analysis
- US growth and inflation prints both miss expectations.
- USD is still the cleanest shirt in the laundry basket.
Q1 Trading Forecasts for a wide range of Currencies and Commodities including USD with our fundamental and technical medium-term technical outlook.
How to Combine Fundamental and Technical Analysis.
Technical Forecast for US Dollar: Neutral
The recent strength of the US dollar in the face of weakening growth and below-target inflation prints, and near multi-month low US Treasury yields, has left many traders confused. The FOMC, and the market, has all but priced out any further interest rate hikes in 2019, while the Fed’s balance sheet normalization program is being slowed down from May and put on hold in September this year. Against this backdrop most currencies would fall lower, testing support levels. The greenback however is not playing by traditional rules with the US dollar basket within touching distance of highs seen back in late-June 2017. This may be partially explained by the USD being ‘the best of a bad bunch’ with both the EUR and GBP continuing to battle with their own problems.
Why Does US Yield Curve Inversion Matter?
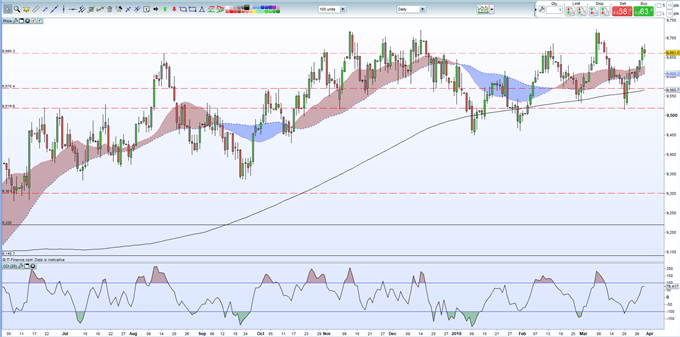
The US Treasury curve continues to drift in and out of inversion – short-end yields higher than long-end yields – normally a recessionary warning light, but the greenback still moves higher. The technical set-up of the DXY (US dollar basket) is now showing signs of a late-rally exhaustion and is struggling and while it remains very close to, but under the recent 97.23 highs made on December 14 and March 7, it will need some strong data to break conclusively above here. The 61.8% Fibonacci retracement of the January 17, 2017 – February 18, 2018 move is at 97.74 and will prove a tough resistance level to break if recent highs are taken out. To the downside, initial support from the 20- and 50-day moving averages before an important zone where the 50% retracement of the previously noted move cuts in at 95.87, just above the 200-day moving average at 95.65. The CCI indicator is also nearing overbought territory and may restrain any further upside momentum.
I remain neutral on the short-term outlook for the US dollar but with a bearish undercurrent.
Looking for a fundamental perspective on USD? Check out the Weekly USD Fundamental Forecast.
US Dollar Basket Daily Price Chart (July 2018 – March 29, 2019)
How Central Banks Impact the Forex Market
Interest Rates and the Foreign Exchange Market
DailyFX has a vast amount of resources to help traders make more informed decisions. These include a fully updated Economic Calendar, and a raft of constantly updated Educational and Trading Guides
--- Written by Nick Cawley, Analyst
To contact Nick, email him at nicholas.cawley@ig.com
Follow Nick on Twitter @nickcawley1
Other Weekly Technical Forecast:
Crude Oil Prices Edge to 5-Month High, Doesn't Feel Like a 'Breakout'


