Crude Oil Technicals Talking Points:
- US crude prices closed Friday to the best quarter in a decade, yet the progress on the week is restrained
- As the market moves above $60, a lack of pace, low volatility and strong ‘risk’ correlations worry
- See how retail traders are positioned in US and UK crude oil in real time
Technical Forecast for Crude Oil Prices: Bullish
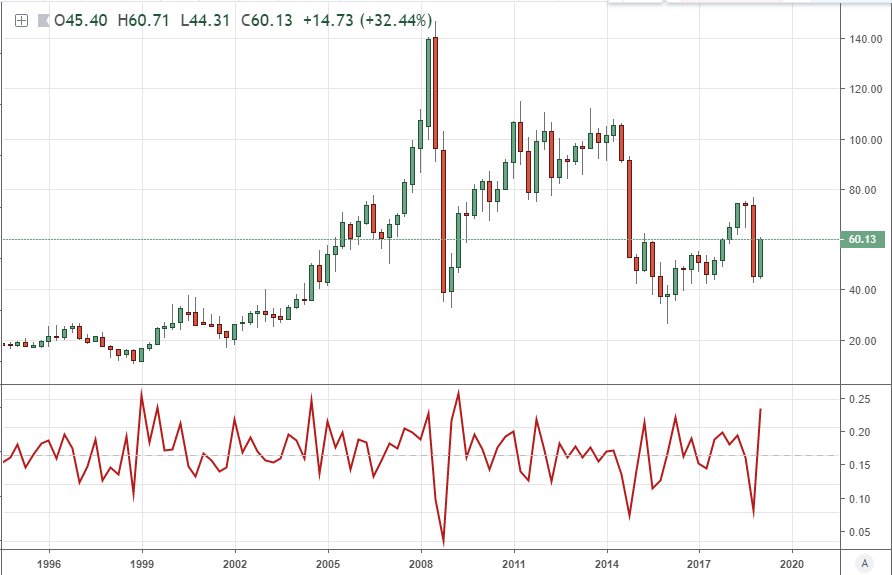
With this past Friday’s close, we have not only cleared a week, but the month (March) and quarter as well. From a 30,000-foot view, crude oil’s performance through Q1 was exceptional. In a raw measure of movement, the commodity posted its biggest three-month rally (32 percent) since the second quarter of 2009. That is a remarkable performance for the market and it is easy to project assumptions for next steps. However, it is important to look more closely than just the quarterly candles. Even at this scale, we can tell that the best quarter seems a product of an even more extreme tumble the period before. That registers as reactive rather than productive. Further, previous instances of extreme declines have not prompted equivalent recoveries nor even the ability to fully unwind those preceding losses.
Chart of US Crude Oil with 1 Period Rate of Change (Quarterly)
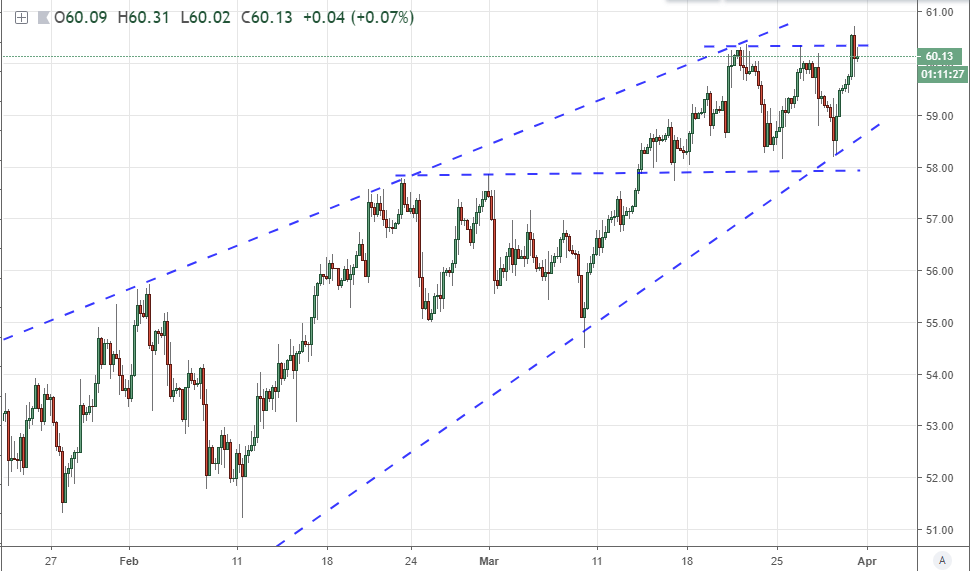
On the opposite end of the time frame spectrum, we find pacing is much less inspiring than what we encapsulate into a single quarterly candle. On the four-hour chart below, we can clearly see the hard fought progress working its way out over the weeks. Through Friday, the bulls were driving hard to overtake the cap on 60.30 – 58.00 range that has been in place over the past two weeks. On an intraday basis, the market managed to overtake the double top high, but there was little follow through on the effort. Perhaps this is merely a function of the fading liquidity into Friday, but it does not set the scene for overwhelming follow through to start next week.
Chart of an US Crude Oil (4-Hour)
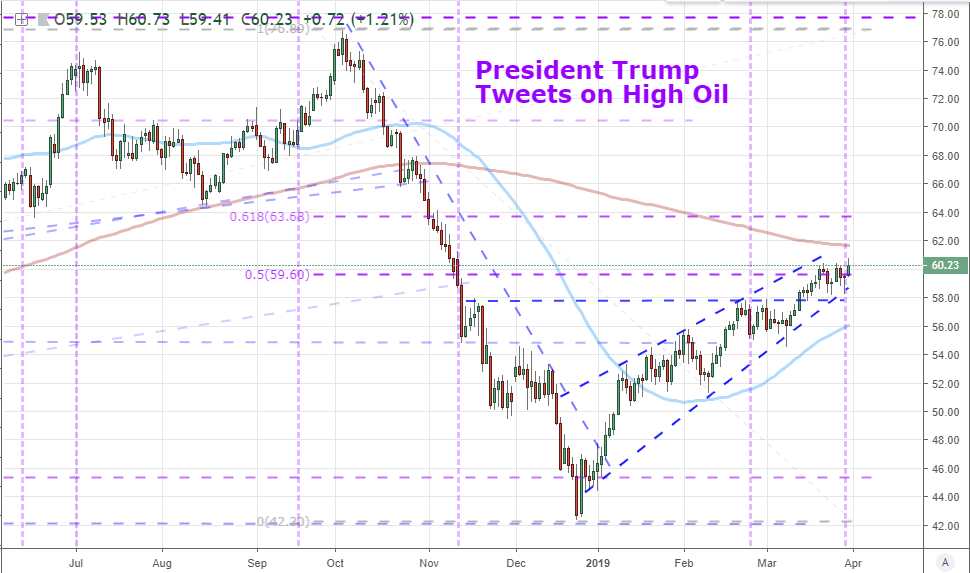
On my preferred time frame charts – daily – we see both the extraordinary bearish-to-bullish structures over the past six months, as well as the struggle more recently to translate bullish interests into progress. There are a few meaningful technical cues to note in the chart below. The 200-day moving average is standing overhead at approximately 61.65, we are overtaking the midpoint of the October to December tumble and there is a sense of waning momentum in the channel that took root in late December. Also a prominent point on the chart below is the instances where the US President has attempted to ‘jawbone’ the commodity lower, to very limited success. I am not watching the headlines for either President Trump’s insights or OPEC’s supply updates as I doubt they can muster enough of an impact to override the speculative rank’s current aversion to trend. That said, volatility is critical to keep track of.
US Crude Oil with 50-day and 200-day Moving Averages (Daily)
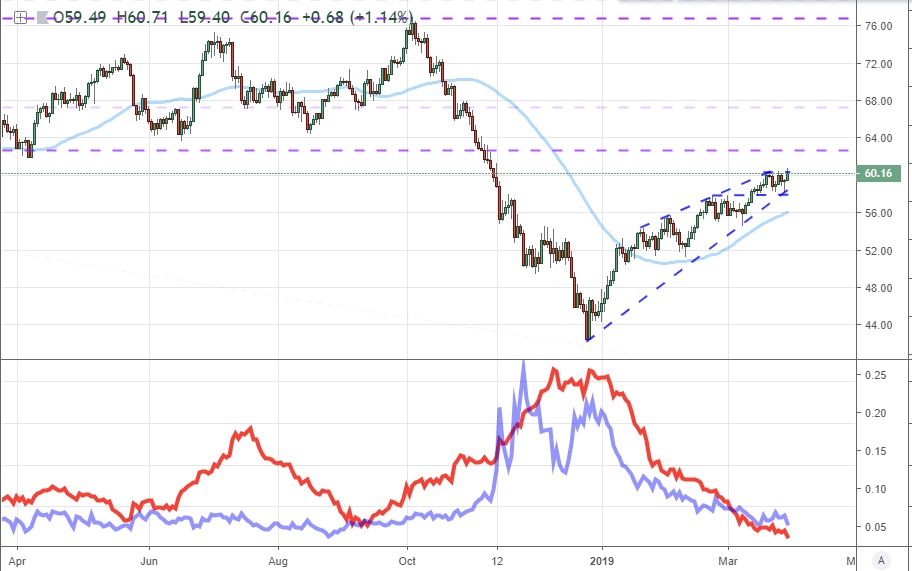
Speaking of volatility, assumptions and activity are set far too low. Below, we have both expected and historical volatility. The red line is actual volatility in crude oil priced measured as the 20-day average true range. It is the lowest we have seen since January 2018. Comfort in bull trends has further reinforced expectations of controlled oil market volatility with the CBOE’s activity measure for the commodity itself at an October low. As it happens, implied volatility seems to be strong across many assets that have a common denominator in risk trends – equities, emerging markets, yields, etc. It is possible that markets are simply settling down for a long period of reflection, but 2018 should stand as a lesson that we cannot fall back on those assumptions and not face considerable risk of another wave.
US Crude Oil with 50-day Moving Averages, 20-day ATR and CBOE’s Oil Volatility Index (Daily)
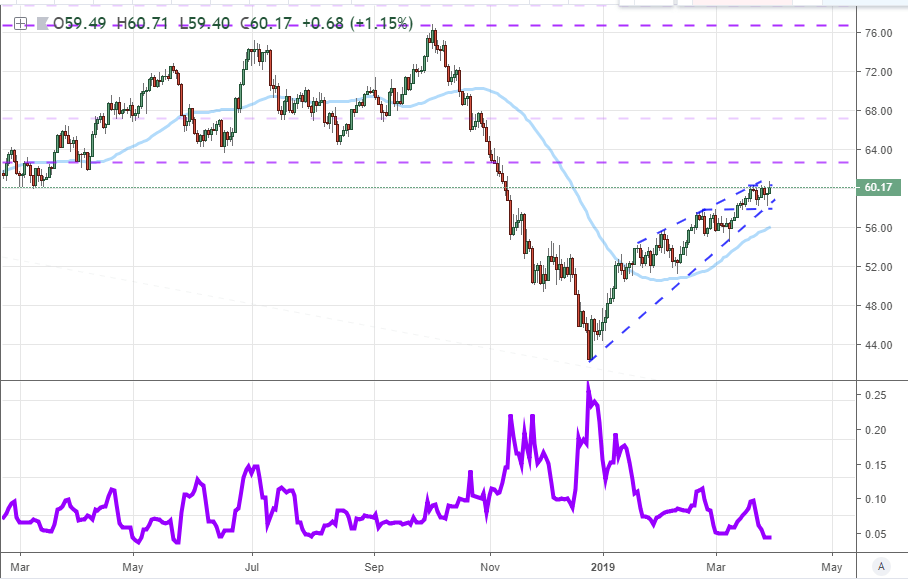
One of the problems with low volatility is that it can lull us into unrealistic expectations of steady and bullish-leaning markets. This is certainly one of the assets whereby there exists an inverse correlation between direction and volatility level (ie as markets climb, volatility drops and vice versa). If volatility is therefore likely to ‘normalize’ it will carry with it the risk of a bearish move. That would run against the prevailing trend at present, but that would suggest it has greater potential for gaining traction. Meanwhile, the range on the market is extremely tight. In fact, the 10-day historical range as a percentage of current spot is the lowest we have seen since October – before the significant trends developed. Taken together, a break is likely in the short-term, but the strength of follow through is disproportionately supportive of a bearish move below 58.
US Crude Oil with 50-day Moving Average and 10-Day Historical Range (Daily)
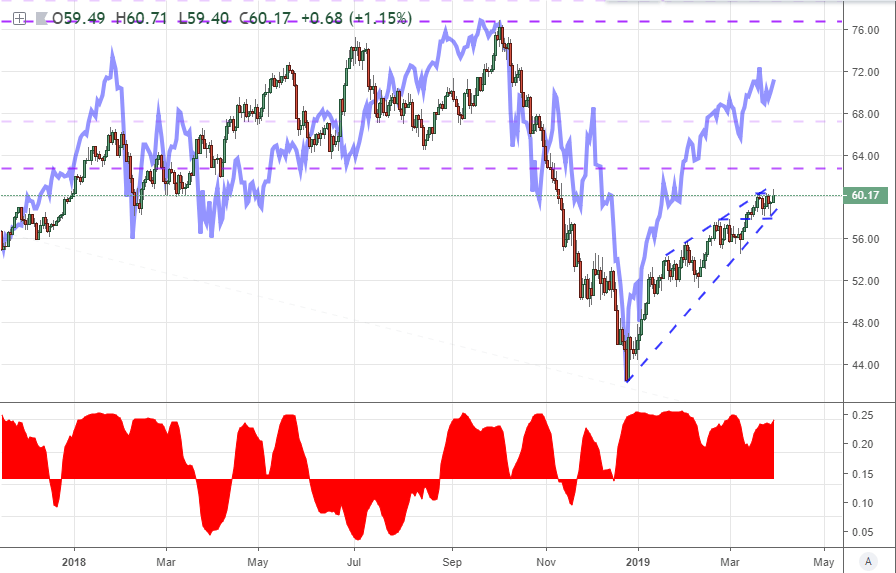
Though the principal focus here is technicals, that doesn’t mean we should write off the influence of fundamental motivation. Where Trump tweets and OPEC warnings will struggle for serious traction – as discussed above – there is a more systemic driver that we can follow in a rather simple comparison. Crude oil is a risk-based asset with a little more rudimentary economic connection than a purely financial product like the S&P 500 and shares. The fact that crude has trailed the index is in part recognition of its connections to more traditional measures of value. Nevertheless, the general connection is an important one to watch. With a strong general correlation (the red surface is a 20-day correlation coefficient), a sharp decline in stocks and risk in general could result in an exceptionally strong response from crude oil. In contrast, just as the advance is more difficult for the S&P 500 moving forward, so too could crude find an advance throttled.
US Crude Oil with S&P 500 and 20-Day Correlation Coefficient (Daily)
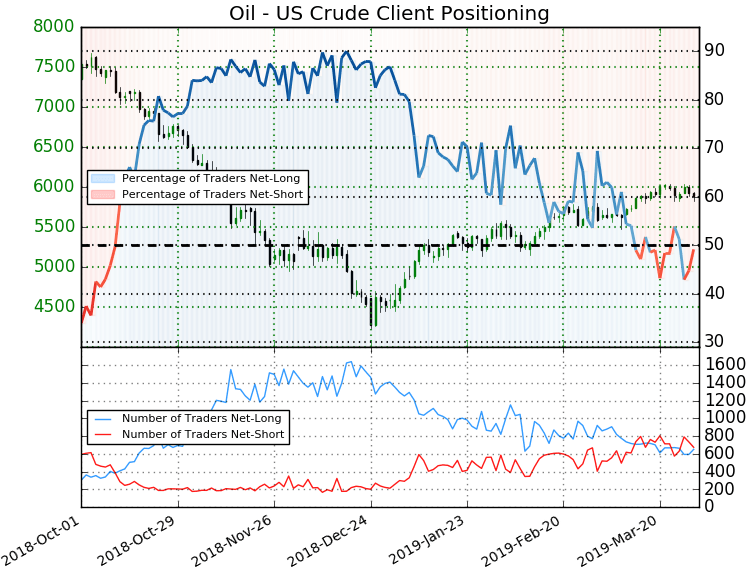
In terms of positioning, large speculative futures traders have started to buy into the possibility of a systemic reversal from the market. We’ve seen a shift favoring a build up of net long exposure following the record high we set nearly a year ago. Just as the high in speculative interest was disproportionate to the level of the underlying, the unwinding fell far short of the lows established in the market. Volatility in positioning is likely to remain high which means volatility in the underlying will likely result. In the meantime, retail traders have transitioned to range trading with a net position flipping back and forth around a balanced exposure, which is far more practical given conditions. While general habit shortfalls for the retail crowd sometimes make their actions a contrarian signal, this may be an environment that proves their interests appropriate.
Looking for a fundamental perspective on oil? Check out the Weekly Crude Oil Fundamental Forecast.
Chart of Net Speculative Positioning in Crude Oil Positions from CFTC Report (Weekly)
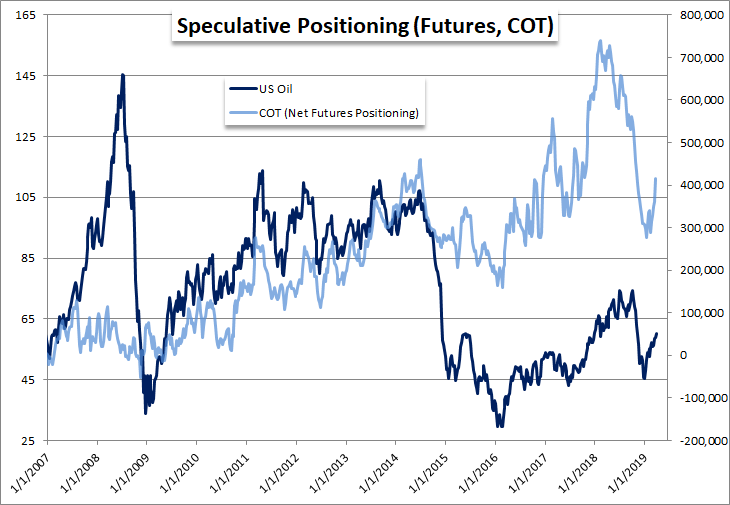
Chart of Retail Trader Positioning from IG Clients (Daily)