


Talking Points:
- Continued gains by global equity markets through the second week of January helped AUD/JPY and NZD/JPY lead the way higher.
- However, developed currency crosses like EUR/JPY and USD/JPY lagged the pack, dogged by speculation around both ECB and Fed policy becoming more dovish in 2019.
- Changes in retail trader positioning suggest a ‘mixed’ outlook in the near-term for the Japanese Yen.
See our long-term forecasts for the Japanese Yen and other major currencies with the DailyFX Trading Guides.
Technical Forecast for the Japanese Yen: Neutral
In our technical forecast last week following the Japanese Yen flash crash, we said that “the only way the reversals matter is if global equity markets continue to rally.” Indeed, with equity markets in Asia, Europe, and North America continuing to rally, the high yield, risk-correlated JPY-crosses AUD/JPY and NZD/JPY gained +1.41% and +1.46%, respectively, over the course of the past week. No doubt, the fate of these pairs is tied to further advances by stocks.
Even though the Japanese Yen dropped last week against all but one of its major counterparts, it is the fourth (out of eight) best performing major currency so far through 2019. To this end, it’s clear that the two worst performing JPY-crosses last week, EUR/JPY and USD/JPY, are still ripe with potential for more downside. As we also noted last week, “demand for the Yen will return quickly in another bout of risk aversion.” If there are two JPY-crosses with potential for downside over the coming week, it’s these two.
EUR/JPY Price Chart: Daily Timeframe (April 2017 to January 2019) (Chart 1)
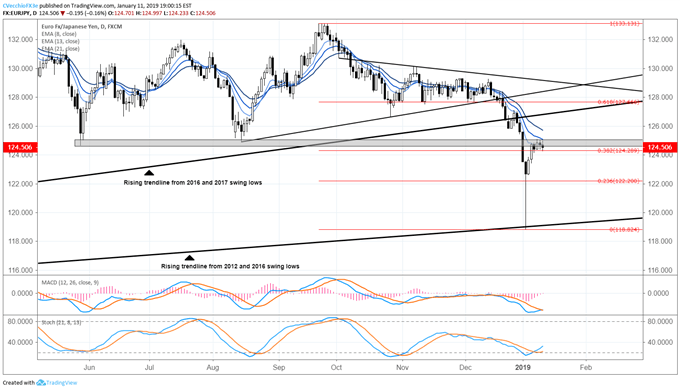
Even though EUR/JPY finished positive on the week, the performance was entirely due to gains on Monday, January 7; Friday’s close at 124.51 was lower than Monday’s at 124.72. Thus, the lack of additional upside alongside the rest of the JPY-complex is a concern and leaves EUR/JPY exposed if stocks take another leg lower (and in turn, EUR/JPY should continue to lag if stocks continue to gain).
Even though their declines have been arrested, both Slow Stochastics and daily MACD remain pointed lower in bearish territory; crossovers back to the topside have not transpired. Similarly, price continues to stay below its daily 13-EMA, which it had closed beneath every session since December 14, 2018. It’s worth noting that the former support region identified last week around the May and August 2018 swing lows (124.62/125.05) has turned into major resistance; this area must still be overcome if the flash crash reversal is to gain true legitimacy.
USD/JPY Price Chart: Daily Timeframe (December 2017 to January 2019) (Chart 2)
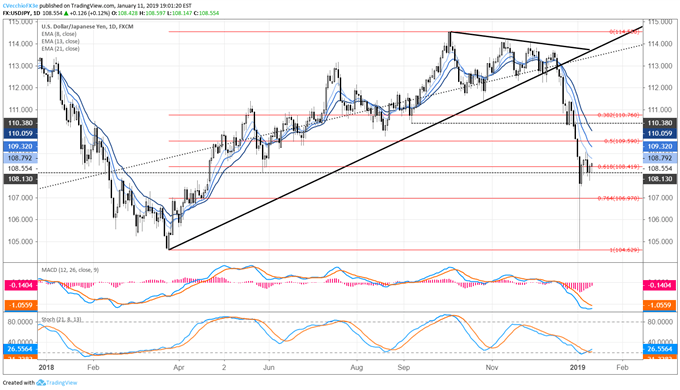
USD/JPY was the only JPY-cross that lost ground last week, with the Yen posting a +0.03% gain versus the US Dollar. While there were gyrations between gains and losses, ultimately, the weekly candle yielded a doji – a sign that the predominant trend has paused, but may not be finished yet. As such, both Slow Stochastics and daily MACD remain in bearish territory, although the former has started to turn higher.
Accordingly, the last week has produced nothing new in terms of USD/JPY’s near-term technical structure. The pair continues to treat its daily 8-EMA as resistance, which it has closed below every session since December 17, 2018; a move back above the daily 8-EMA would be welcomed by bulls, suggesting that the downturn from mid-December was over.
For bears, the close at 108.48 inches closer to a weekly close below 108.42, the 61.8% retracement of the entire 2018 March low-to-October 2018 high move. A weekly close below 108.42 would suggest USD/JPY wouldn’t just be retracing its gains from 2018, but indeed was setting off on a new downtrend altogether. Both the bear and bull case are on the table over the coming days after last week’s doji candle.
FX TRADING RESOURCES
Whether you are a new or experienced trader, DailyFX has multiple resources available to help you: an indicator for monitoring trader sentiment; quarterly trading forecasts; analytical and educational webinars held daily; trading guides to help you improve trading performance, and even one for those who are new to FX trading.
--- Written by Christopher Vecchio, CFA, Senior Currency Strategist
To contact Christopher, email him at cvecchio@dailyfx.com
Follow him in the DailyFX Real Time News feed and Twitter at @CVecchioFX.


