


Talking Points:
- The DXY rallied following the US mid-term elections and FOMC decision, in reach of 16-month highs
- An equally-weighted measure is more appropriate to chart for intent, and it is in the middle of range
- See how retail FX traders are positioning in Dollar-based majors like EURUSD on the sentiment page
Technical Forecast for US Dollar: Neutral
The Dollar put in for an abrupt reversal this past week, which likely heartens hold out bulls awaiting the return of traction. However, the correction and three-day advance to close this past week likely has more to do with volatility than it does conviction. The combination of the mid-term elections and FOMC rate decision this past week leveraged traders’ attention and likely urged some defensive positioning. The aftermath of the events naturally spurs repositioning on the clearer course settings and with sidelined interests rushing back in. That does not, however, mean that we have necessarily turned any major corners in outlook or activity levels. It is this backdrop of conditions that we should pay more attention to than where the next viable level is with each swing. Otherwise, we may register a breakout and trend scenario where a range is more likely to develop. In the DXY Index’s daily chart, the Wednesday reversal confirmed a short-term rising trend channel stretching back the past two months. I only take a trendline seriously with three distant tests of the level, and the dip to 95.65 was the third. As we head into the new trading week, the 97.20 figure established as the high from the October 31st session – itself a 16 month high – will naturally be assumed as the ‘line in the sand’. That said, general mantra of mine is that breakouts are not trends. Don’t assume follow through simply because a barrier has been crossed.
Chart of DXY Dollar Index (Daily)

One technical point of concern when evaluate the immediate motivation of speculative follow through over the coming week is the historical runs that we’ve seen from this benchmark measure. With Friday’s close, we have seen the Greenback climb for four consecutive weeks – the strongest four week run since March. However, we haven’t seen a five-week climb since July 2016 and nothing longer than that since early 2015. It is certainly not impossible to generate a longer advance, but it would be statistically unusual. If there is any question in intent – whether that be fundamental or purely speculative – it is better to follow the averages.
Chart of DXY Dollar Index and Consecutive Bars (Weekly)

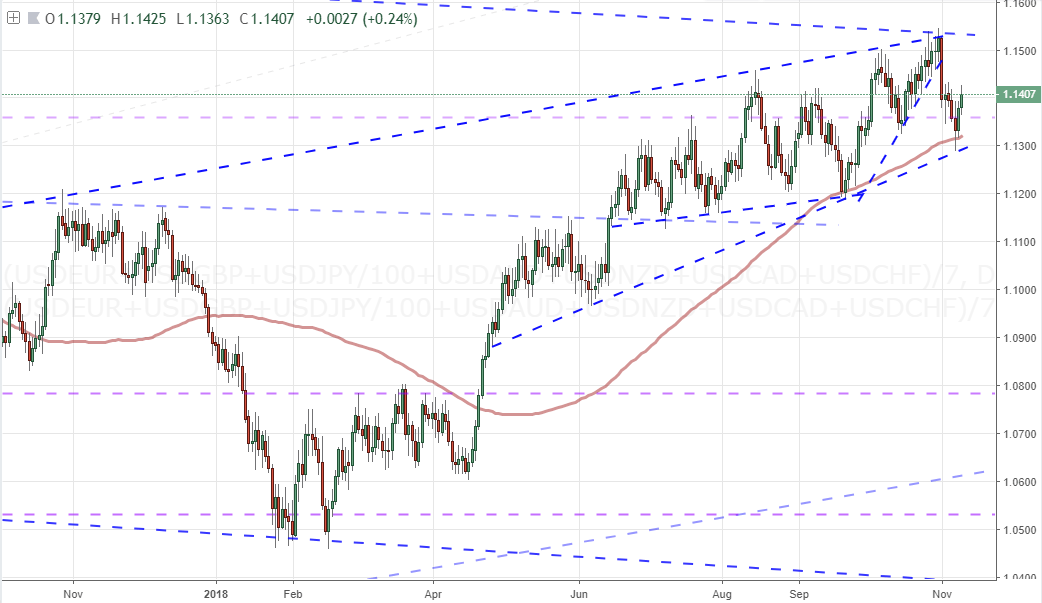
Another consideration for the immediacy in resistance from the DXY Index in particular is the influence of its composition. A trade-weighted index, the bulk of its performance is sourced on EURUSD – with the Euro struggling significantly these past few months. Looking to an equally-weighted measure of the Greenback, we still have the bullish lean (as can be seen below), but the swing high is further away. If we saw the same degree of rally as we’d experienced the second half of this past week – again charged by FOMC and mid-term elections volatility – it would get us back to that key level and resistance. Assessing breakout potential, the terms are very different when you are at the technical boundary versus when you are in the middle of the range.
Chart of Equally-Weighted Dollar Index (Daily)
Much of what we have seen from the Dollar in terms of momentum and direction seems to be draw more from the indirect drive from major counterparts rather than the intent of the Greenback itself. Therefore, traders should look for unexpected jolts of volatility – which could turn into the genesis of short-term trends – through the charts of the most liquid crosses. The undisputed liquidity champion is EURUSD which has made an explicit floor of 1.1300. There is some technical precedence to the level, but the barriers below should we slip it are less distinct. That could make the inherent Dollar crawl higher easier to facilitate. That said, another bounce at 1.1300 will not go unnoticed by those that trade the pair or the Greenback in general.
Chart of EURUSD (Daily)

The second most liquid major is the Cable. The GBPUSD’s chart looks much more like the equally-weighted index versus the DXY. The reversal from 1.3200 put bears back in charge, but there is still some considerable ground that can covered before we get to any kind of critical technical juncture. Breakouts have the power to draw in a flush of new speculative interest and in turn facilitates the expectations attached to such patterns. Range swings are more passive in natural, but they are also easier to achieve – a path of least resistance. If the low barrier of Dollar buying in GBPUSD continues, it could earn just enough to push DXY’s resistance; but it would not be the sort of move that signaled strong follow through on a key break.
Chart of GBPUSD (Daily)

For technical heft, there are few Dollar-based majors that are staring at the kind of resistance on which USDJPY is reflecting. The 114.50 figure is range resistance that stretches back to February of 2017 and has established enough bona fides to get on most traders’ radars. This is a fundamentally-complicated currency pair with carry trade and risk interests tapping a deep well of speculation. Where EURUSD and GBPUSD may draw more interest for the Dollar trader, I would continue to rely more on USDJPY for signal of intent.
Chart of USDJPY (Daily)

Meanwhile, net speculative futures interest in Dollar continued its measured advance to new multi-year high levels of bullish preference. This interest contradicts what we see in the retail traders’ exposure. The EURUSD sentiment data on DailyFX shows that 65 percent of those with positions in the pair are long, 66 percent of trades in GBPUSD are long and 62 percent in USDJPY are short. That is a considerable preference for picking a Dollar correction as technical boundaries come into view. Which participant is better attuned to the market’s intent?
Chart of Net Speculative Positioning in Dollar Futures Contracts (Weekly)

Other Weekly Technical Forecast:
Australian Dollar Forecast – AUD/USD Bullish Breakout Attempt Fell Short, AUD/JPY Risks Falling


