


- EUR/USD holds weekly doji low
- USD/JPY best 4 week rally ever
- Bond yields – rate of change and slope indicate possible ceiling
-- Subscribe to Jamie Saettele's distribution list in order to receive a free report to your inbox several times a week.
-- Quarterly charts and comments
Weekly

Chart Prepared by Jamie Saettele, CMT
See REAL TIME trader positioning
High Frequency Trading Tools
-2 weeks ago, it looked like EUR/USD was about to go off of a cliff. Many a cliché would work here; it’s always darkest before dawn comes to mind. Anyway, a doji formed during Thanksgiving week and EUR/USD held the doji low this week. The combination of EUR/USD at range lows (same place as last year in fact…EUR/USD closed at 1.0614 on 12/2/2015), the doji, and the proliferation of ‘King USD’ and ‘Europe is done’ stories provide a powerful bullish backdrop.
As always, define your risk points (read more about traits of successful traders here).
-For forecasts and 2016 opportunities, check out the DailyFX Trading Guides.
Weekly

Chart Prepared by Jamie Saettele, CMT
See REAL TIME trader positioning
-The GBP/USD rally contends with its first major resistance point since the October crash. The levels in question are the July low at 1.2791, August low at 1.2865 and a long term parallel that has cut through some big inflection points over the last 7 years. The 96 month (8 year) cycle low count is still in the back of my mind as well.
Weekly

Chart Prepared by Jamie Saettele, CMT
See REAL TIME trader positioning
-There is no change to recent comments as AUD/USD has followed through on the bearish outside week. “AUD/USD traded to its highest since the week of the April high and closed at its lowest week since mid-October. The bearish outside week is…bearish, until further notice. As noted a number of times in recent weeks, a weekly close above .7719 is needed in order to signal a major upside breakout. The action suggests that Aussie is vulnerable.”
Weekly
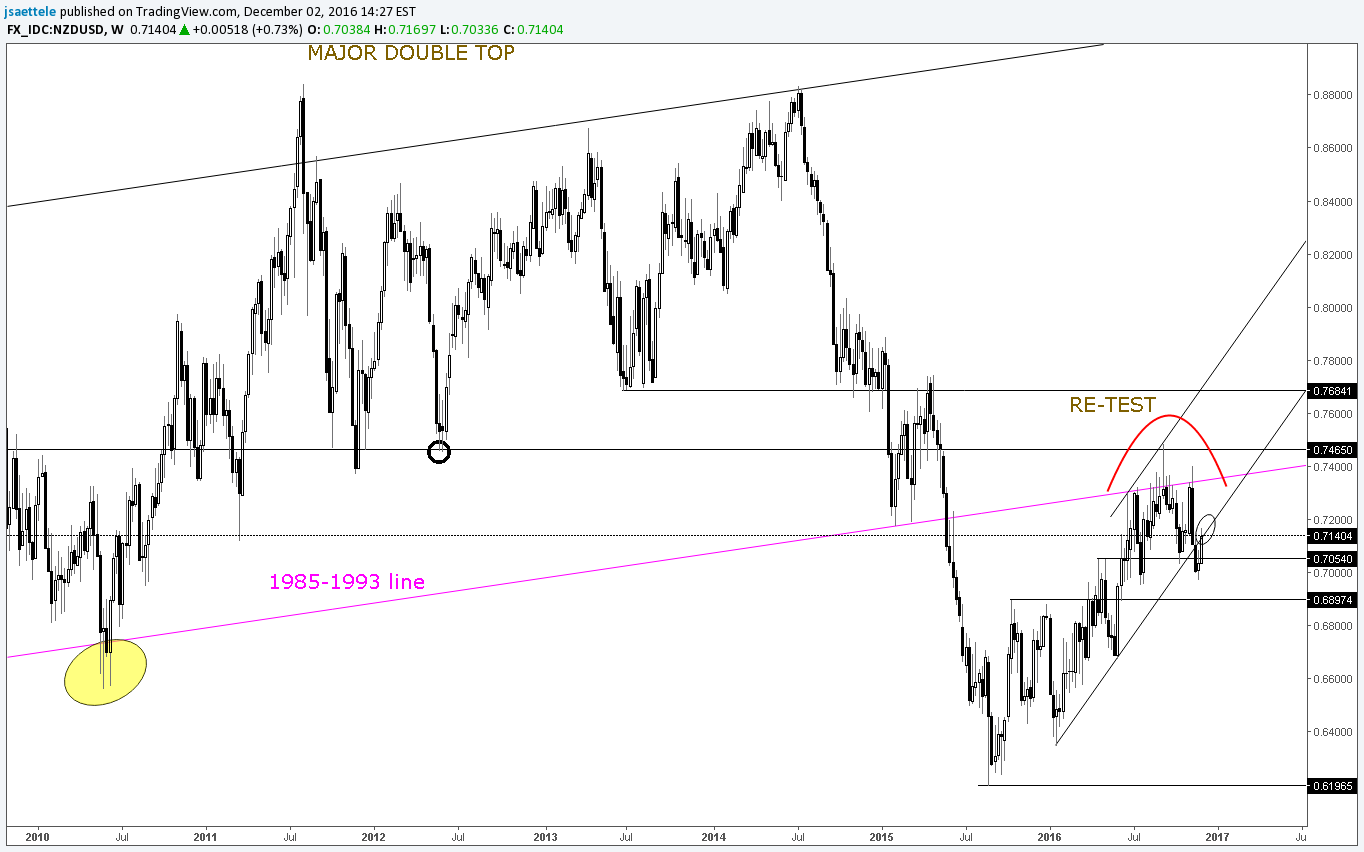
Chart Prepared by Jamie Saettele, CMT
See REAL TIME trader positioning
-There is no change to NZD/USD analysis other than noting that the rate is testing the underside of former trendline support. “After reversing from the ‘magnetic’ 1985-1993 trendline, Kiwi carved a bearish outside week which suggested that the interpretation of price action since July as a top, rather than consolidation, would win out. The break under trendline support this week reinforces the idea that NZD/USD is headed lower. In fact, the entire rally from August 2015 may be just a re-test of the long term bear move that began with the double top confirmation in early 2015.”
USD/JPY
Weekly

Chart Prepared by Jamie Saettele, CMT
See REAL TIME trader positioning
-USD/JPY has rallied a bit over 10% in 4 weeks. That’s the largest 4 week rally ever. 4 week rallies in excess of 8% occurred in August 1995, March 1999, February 2007, and November 2014. The results after those moves are mixed. The middle 2 instances were near big peaks. The 1995 instance signaled the beginning of a major move higher from what was then the all-time low. The most recent instance was the beginning of the end of the USD/JPY rally from 2011. Price wise, the May high at 111.44 was support this week and that level needs to give in order to indicate even a minor behavior change. The floor from late 2014 through early this year should be monitored for resistance in the mid-115.00s.
Weekly
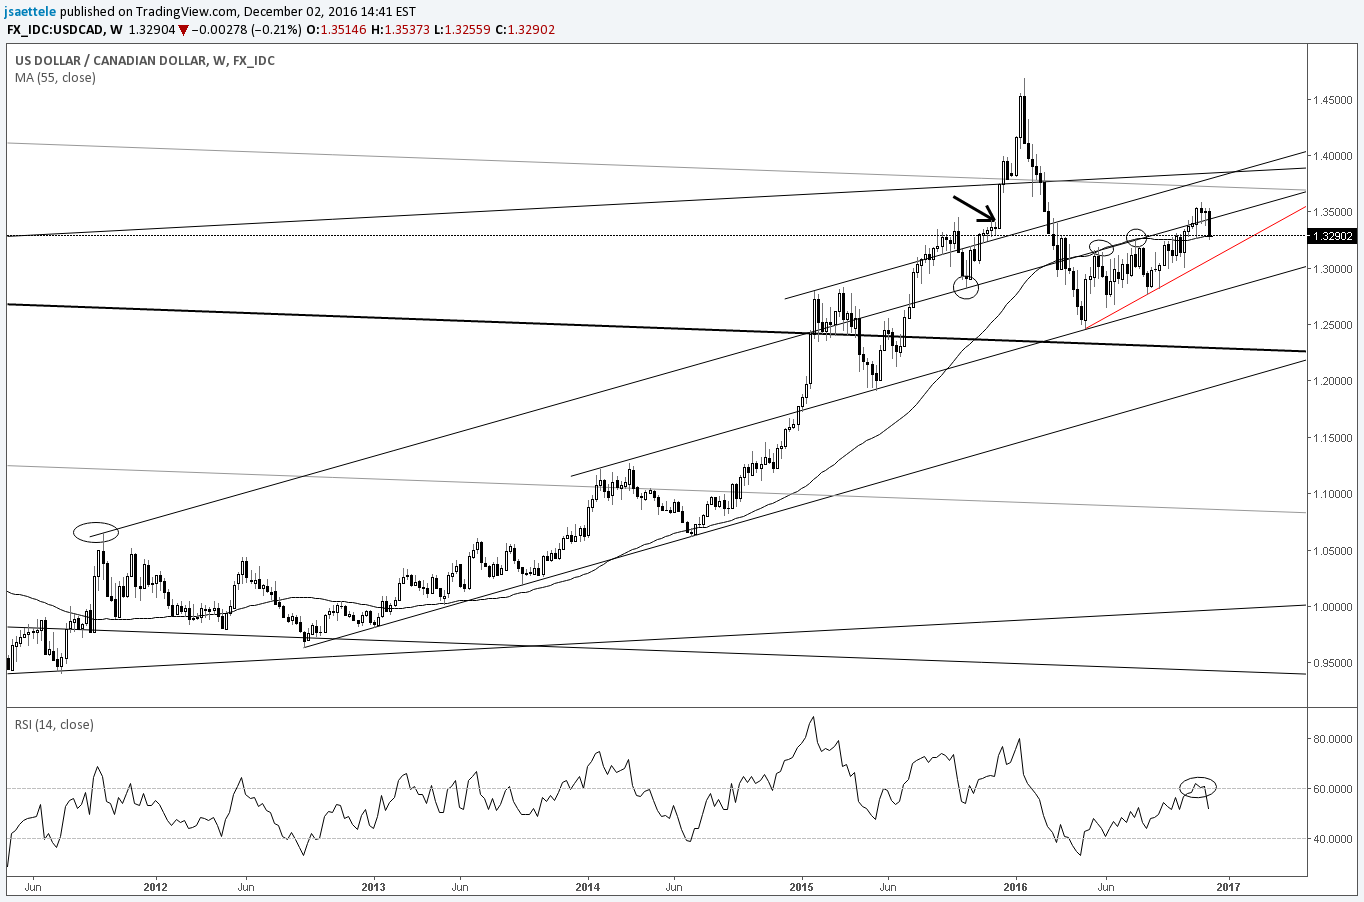
Chart Prepared by Jamie Saettele, CMT
See REAL TIME trader positioning
-I wrote in the last update that “USD/CAD remains constructive and the next spot on the chart is 1.3800.” This week’s drop negates the constructive outlook and brings back the possible bearish wedge (red line is the lower wedge boundary) scenario from the May 2015 high. Weekly RSI turning over at 60 is typical of sideways or downward trends. Also, notice that the rate has turned down from the same price region that price accelerated higher from exactly one year ago. The observation suggests a good deal of vested interest in the price region and therefore potential for an important change to take place.
Weekly
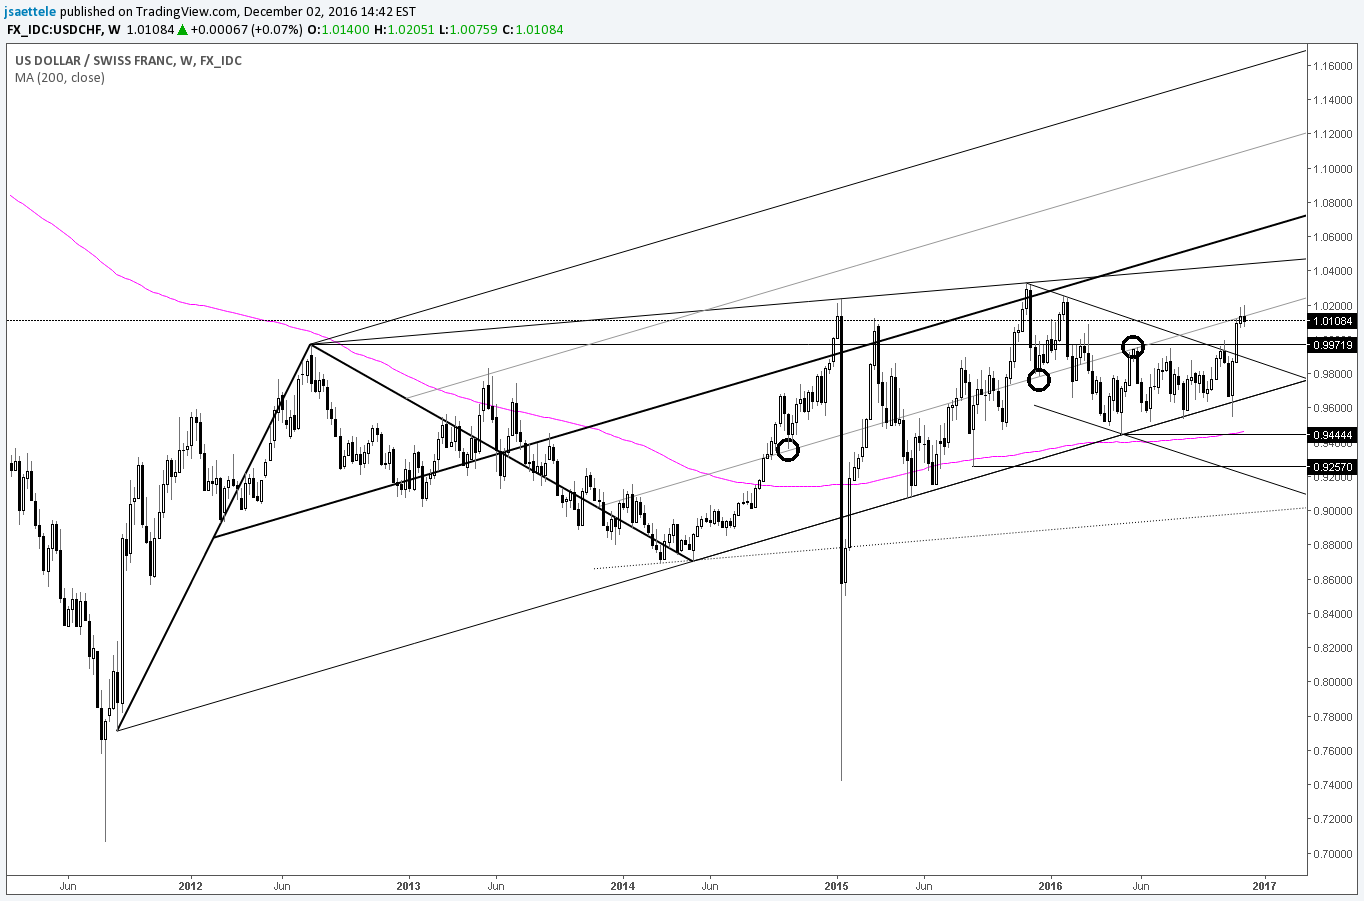
Chart Prepared by Jamie Saettele, CMT
See REAL TIME trader positioning
-Don’t forget about the long term time symmetry described here.” The rectangle breakout has materialized. Given probes of a VERY long term parallel beginning in November 2015, this rectangle could end up launching a major behavior change and rally to 1.15 or so (trendline from 1985). A check on the breakout level would result in a dip below parity.
Bonus Chart
Yield on 30 Yr. U.S. Treasury Bond
Weekly
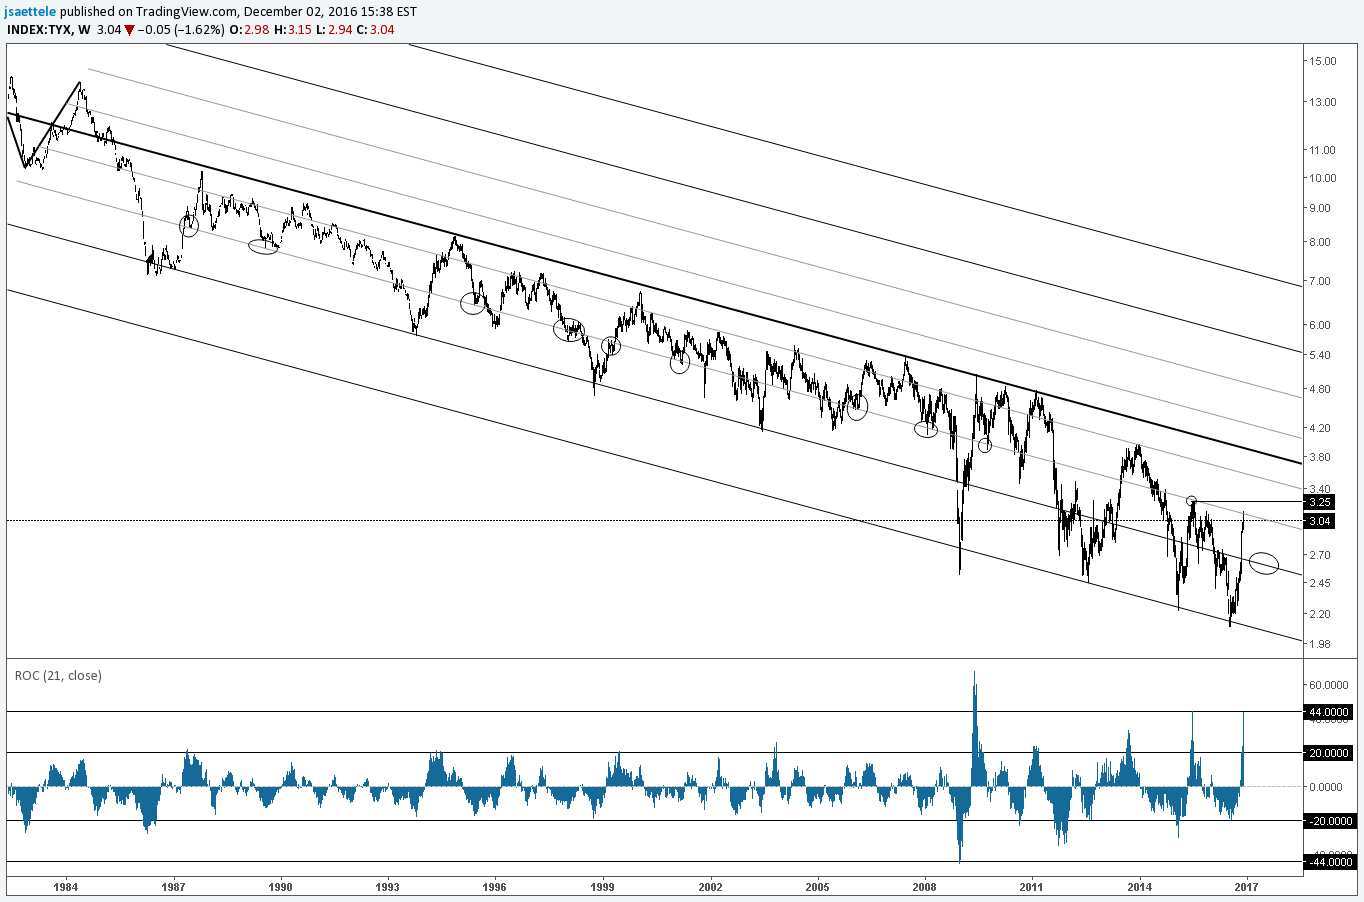
Chart Prepared by Jamie Saettele, CMT
See REAL TIME trader positioning
-The 30 year Treasury Bond yield has rallied 44% in 21 weeks (the low was 21 weeks ago and I’m using weekly closing prices). This is the same rate of change that was registered in June 2015, which was the most recent peak. The only larger rate of change (since 1981) was the 68% rally after the financial crisis into May 2009. Yield topped 4 weeks later. There is something about a nearly 50% move in 21 weeks; the lowest rate of change recorded was -45% during the financial crisis. That week’s reading was the low. Needless to say, the move in yield is extreme and I’m looking for a turn lower. Watch for support in the 2.6s. For more, check out this video.


