


Mexican Peso Outlook:
- Amid a global commodity price boom in recent weeks, the Mexican Peso has benefited, achieving or nearing yearly highs versus the Japanese Yen and the US Dollar.
- MXN/JPY rates are flagging after trading through multi-year downtrend resistance, suggesting a major turn may be arriving soon.
- We can use the IG Client Sentiment Index for USD/CAD rates as a close proxy for USD/MXN exposure, which has a mixed bias.
Mexican Peso Retaining Strength
Throughout the month of April, the combination of stability in long-end global bond yields and a surge in global commodity prices, particularly agriculture and a subset of base metals, has provided a sturdy base from which the Mexican Peso has been able to rally. For the most part, price action remains in line with expectations outlined in our 1Q’21 Top Trade Opportunities and 2Q’21 Top Trade Opportunities. With signs that the US economy, Mexico’s largest trading partner, is gaining steam, the Mexican Peso remains a potentially attractive proxy play in a risk-on environment.
Mexican Peso Economic Calendar - Rest of Week
The top risk for markets across the board this week is the April Fed rate decision, which culminates today at 14 EDT/18 GMT. While USD/MXN will be directly impacted thanks to the USD component of the pair, it is likely that all MXN-crosses are impact given the proximity of the Mexican economy to the US economy. Accordingly, if the Fed strikes an optimistic tone about growth while still promising to provide stimulus, it may curate an environment where the US Dollar falls and US Treasury yields rally – a sign that inflation expectations are influencing price action, likely resulting in lower real US yields.
Attention does return to domestic Mexican data by the end of the week, with the release of the 1Q’21 Mexican growth rate on Friday, April 30. Consensus forecasts call for a contraction of -3.5% from -4.3% (y/y) previously. Considering the nature of market participants right now is to look to the other side of the pandemic, evidence of a weaker Mexican economy at the start of 2021 may not dissuade Peso bulls just yet.

USD/MXN Rate Technical Analysis: Daily Chart (February 2020 to April 2021) (Chart 1)
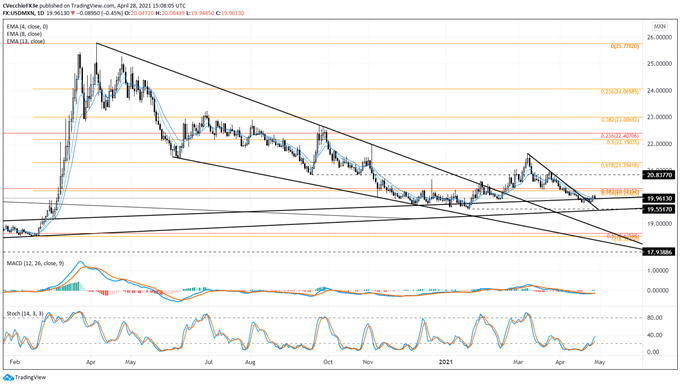
In the prior Mexican peso forecast, it was noted that “the uptrend from the January, February, and March swing lows has been lost…if price action since early-March has resolved itself in the form of a potential head and shoulders pattern, it would hold that more downside towards the yearly lows may be in the cards.” While a drop to yearly lows has not transpired, USD/MXN rates are still below the potential neckline as well as two key Fibonacci levels: the 38.2% retracement of the April 2011 low/April 2020 high range at 20.3215; and the 76.4% retracement of the 2020 low/high range at 20.2349. To this end, even though the downtrend from the intramonth March 2021 highs was broken, the technical structure remains bearish.
MXN/JPY Rate Technical Analysis: Daily Chart (January 2020 to April 2021) (Chart 2)
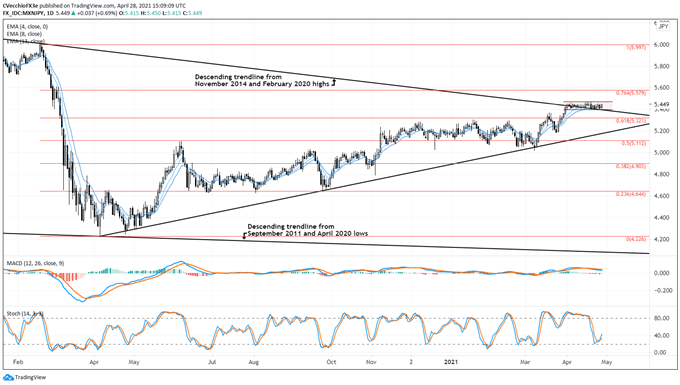
In the prior forecast it was written that that “the pair finds itself testing the descending trendline from the November 2014 and February 2020 highs, a multi-year trendline that also constitute resistance in a symmetrical triangle that’s formed since the start of the coronavirus pandemic.” The passage of time has seen MXN/JPY rates carve out a sideways range as its crept out of the descending trendline from the November 2014 and February 2020 highs, suggesting a bull flag has been carved out.
Accordingly, price action remains bullish for MXN/JPY rates. The pair is above its daily 5-, 8-, 13-, and 21-EMA envelope, which is in bullish sequential order. Daily MACD is holding above its signal line during its pullback, even as price action retains its gains. Meanwhile, daily Slow Stochastics are trending higher from oversold territory; it’s noteworthy that the decline to oversold territory was not accompanied by a drop in price.
It remains the case that “given this context, the recent sideways drift in MXN/JPY rates over the past few days may simply be a pause before fresh highs are reached anew. The 76.4% Fibonacci retracement of the 2020 high/low range at 5.579 may be initial resistance if the bullish breakout ensues.”

Using a Proxy to Track USD/MXN Retail Positioning
With respect to the difference in performance between USD/CAD and USD/MXN rates in recent weeks, it should be noted that the Canadian economy is more independent from the US economy than is the Mexican economy. While the United States is both countries’ largest trading partner, over 80% of Mexico’s exports go to the United States (compared to near 70% for Canada), while 30% of Mexico’s GDP is derived from economic activities involving the United States (compared to 20% for Canada).
The close proximity of both countries given their trade relationship with the United States also means that their currencies tend to trade in a similar fashion as well. In other words, there is a reasonable basis of expectation for USD/CAD and USD/MXN rates to trade in a similar fashion.
However, after the BOC decided to abruptly announce a tapering to their QE program, the relationship between USD/CAD and USD/MXN remains frayed in the near-term. At present, the 5-day correlation between the pairs is currently -0.37 while the 20-day correlation is +0.45. One week ago, on April 21, the 5-day correlation was +0.58 and the 20-day correlation was +0.64.
IG CLIENT SENTIMENT INDEX: USD/CADRATE FORECAST (April 28, 2021) (CHART 3)
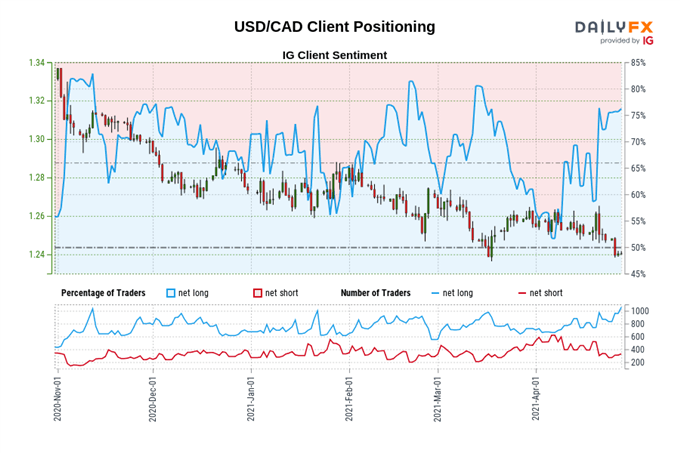
USD/CAD: Retail trader data shows 76.48% of traders are net-long with the ratio of traders long to short at 3.25 to 1. The number of traders net-long is 4.78% higher than yesterday and 59.53% higher from last week, while the number of traders net-short is 8.71% higher than yesterday and 41.59% lower from last week.
We typically take a contrarian view to crowd sentiment, and the fact traders are net-long suggests USD/CAD prices may continue to fall.
Positioning is less net-long than yesterday but more net-long from last week. The combination of current sentiment and recent changes gives us a further mixed USD/CAD trading bias.
--- Written by Christopher Vecchio, CFA, Senior Currency Strategist


