


Key Takeaways From May 1 FX Overbought/ Oversold Report:
- EUR weakness is pervasive and opens up multiple opportunities, GBP & SEK follows suit
- US Dollar may soon see 2018 highs as the position unwind extends
- Canadian Dollar quietly strengthening against weak FX (JPY, USD)
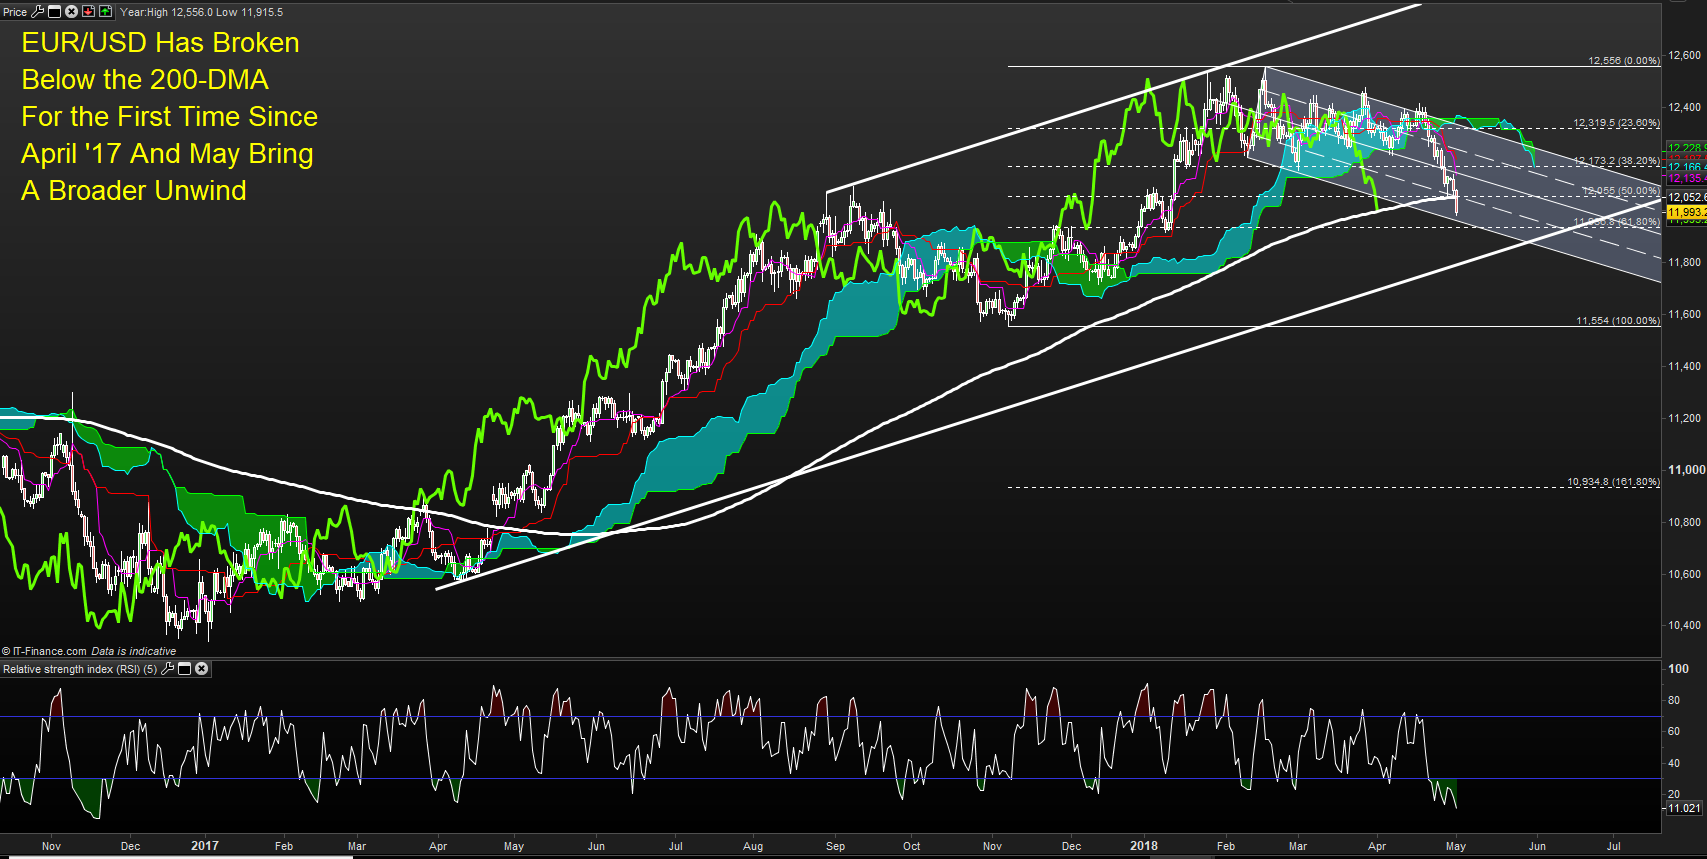
The EUR has broken below $1.20 for the first time since January after falling 0.8% on Tuesday and seeing the US Dollar gain for the 9th day in 11 trading sessions. Much of this move hasbeen foretold in other European currencies like the Swiss Franc and Swedish Krona against the US Dollar.
Another unwind that has taken place over the last few weeks was in cable. After trading toward the 200-WMA, Sterling has fallen to $1.3620 and appeared to target the January 3 high near 1.3613.
In addition to US Dollar strength, the commodity bloc has been widely split with the Canadian Dollar currently the strongest G10 currency of 2Q while Aussie and NZD have set new 2018 lows. The RBA provided a predictably dovish rate announcement of no-change and falling commodities.
EUR/USD Trades < 200-DMA, Breakdown < $1.1936 Opens Up $1.1555
Interested in learning how to manage your trades better? Check out our free trading guides here
Overbought FX Pairs and Individual Currencies as of May 1, 2018
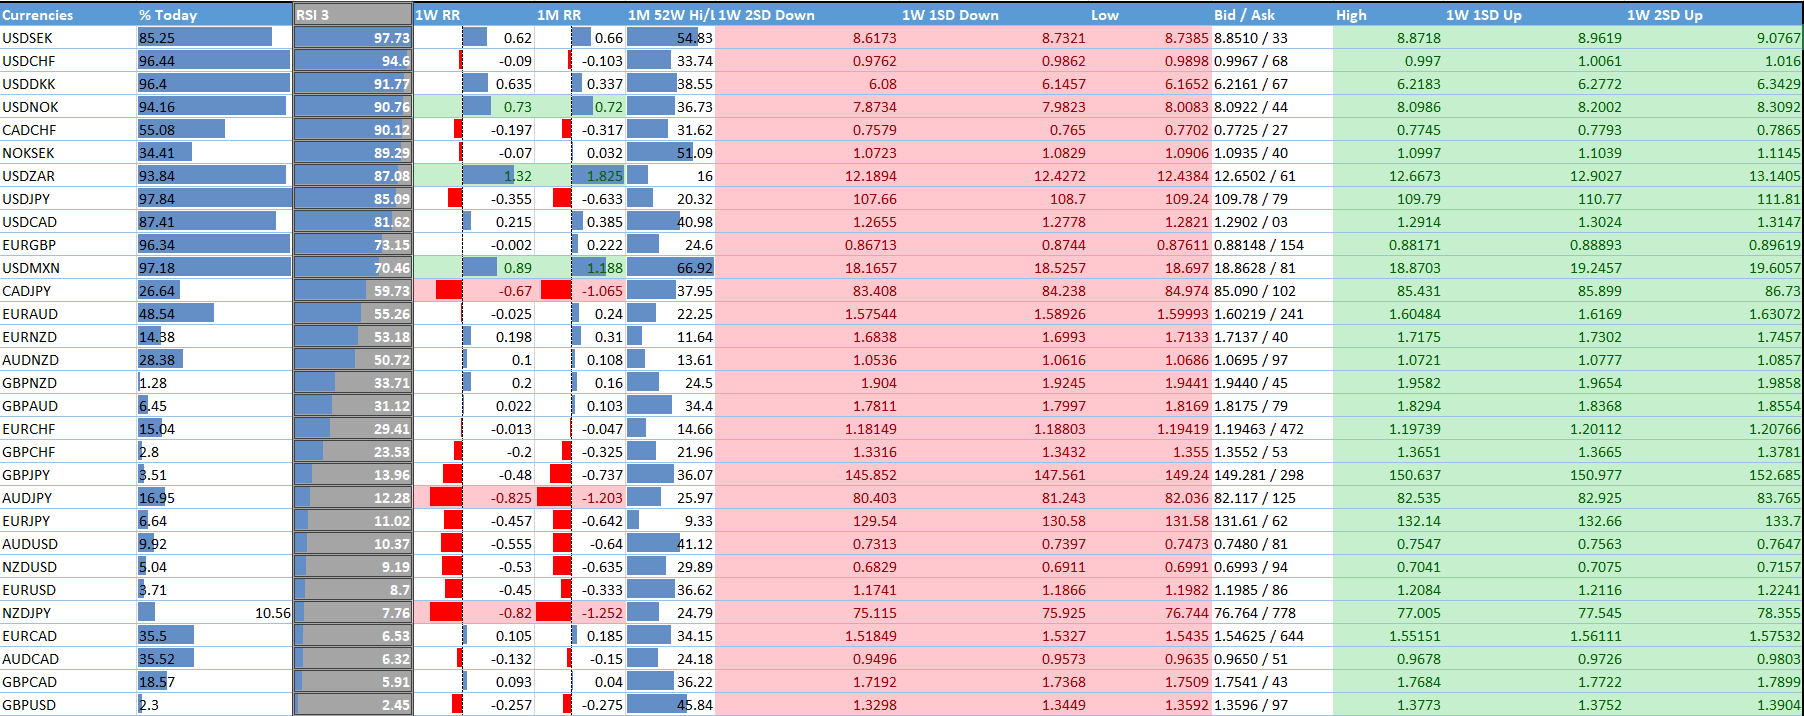
Data source: Bloomberg
A quick look above, and you can see that the 3-top overbought pairs (USD/SEK, USD/CHF, and USD/DKK) per RSI(3) show haven currency, and EU-area weakness like SEK & DKK.
On the opposite side of the distribution, the top-3 weakest pairs per RSI(3) display North American currency strength in the CAD and USD against the GBP and Australian Dollar.
Current FX Opportunities in Focus Per RSI(3)
Sterling has largely declined and may continue to do so alongside the drop in the market’s pricing in of a May BoE hike.
With all Brexit news still clouding the British Pound, find clarity in our GBP Forecast here
While it may be hard to decipher from the data above, it’s worth noting that Quarter to Date, the Canadian Dollar is the only currency in the black against the US Dollar with some large losses already posted.
G8 Quarter-To-Date Rankings As of May 1

Data source: Bloomberg
GBP Breakdown – An Unwind Of A Wildly Popular Trade
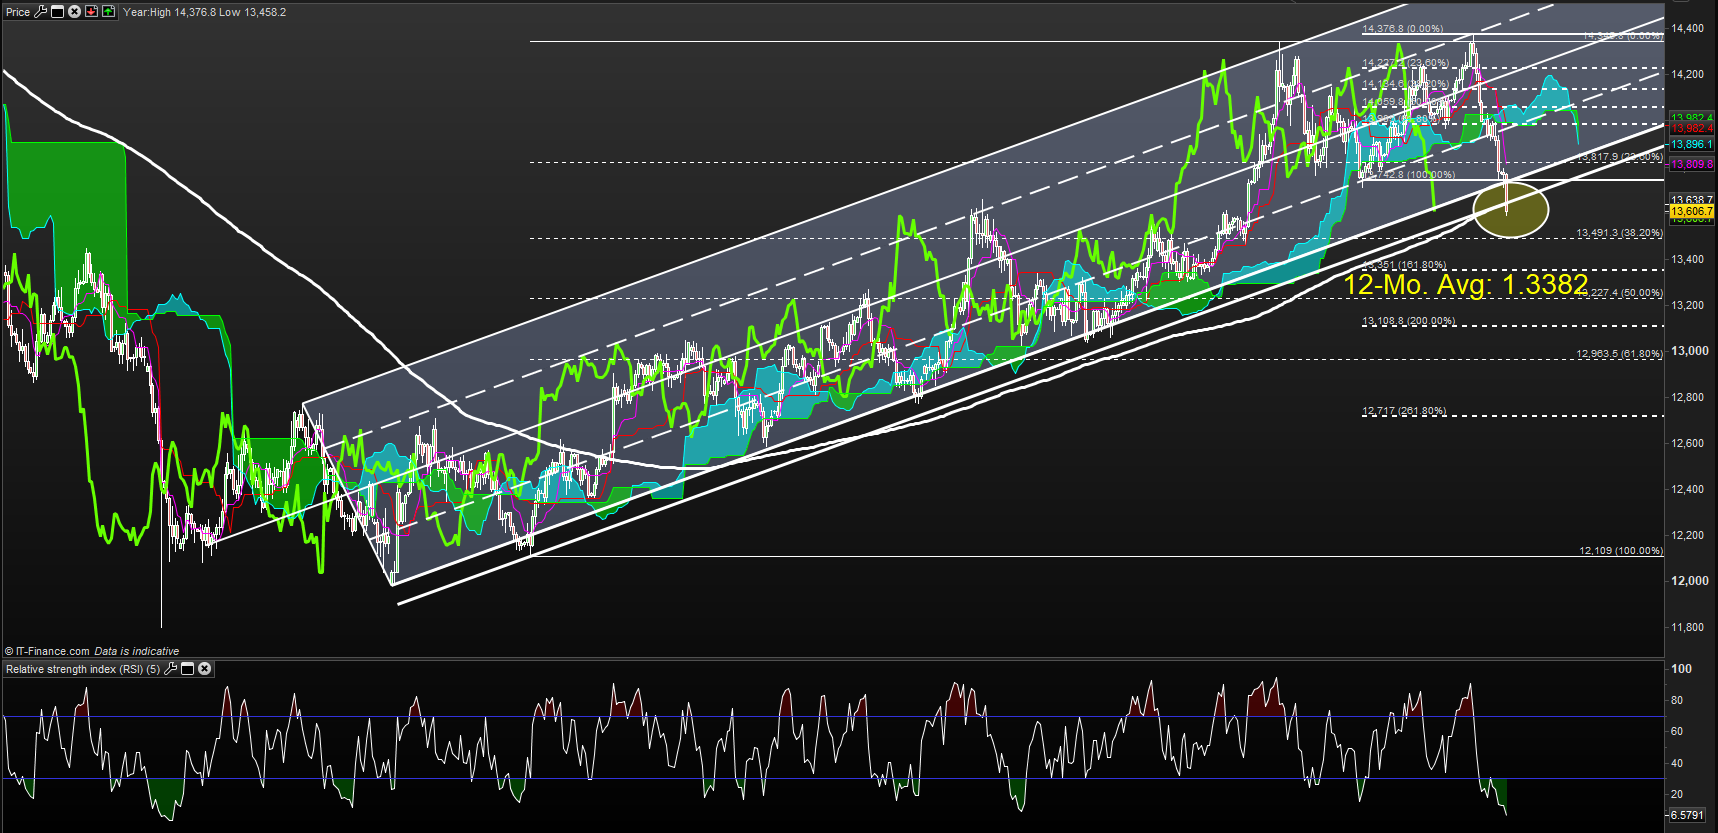
Chart Source: ProRealtime, IG UK Price Feed. Created by Tyler Yell, CMT
Either way you look at it, levels are giving way on both EUR & GBP. The British Pound appeared to find $1.43 too much to handle and a potential double-top may have developed that has a traditional target at 100% of the double-top range below the neckline near 1.32.
Coincidentally, $1.32 per GBP was the level the exchange rate was trading at when the BoE went hawkish last September. Another focal point on the chart on the aggressive mean-reversion move at play is the 12-month average at 1.3382.
Cable has also broken below the 200-DMA in what could be signaled a structural shift of the market’s view on UK’s outlook.
USD Weakness Has Quickly Faded
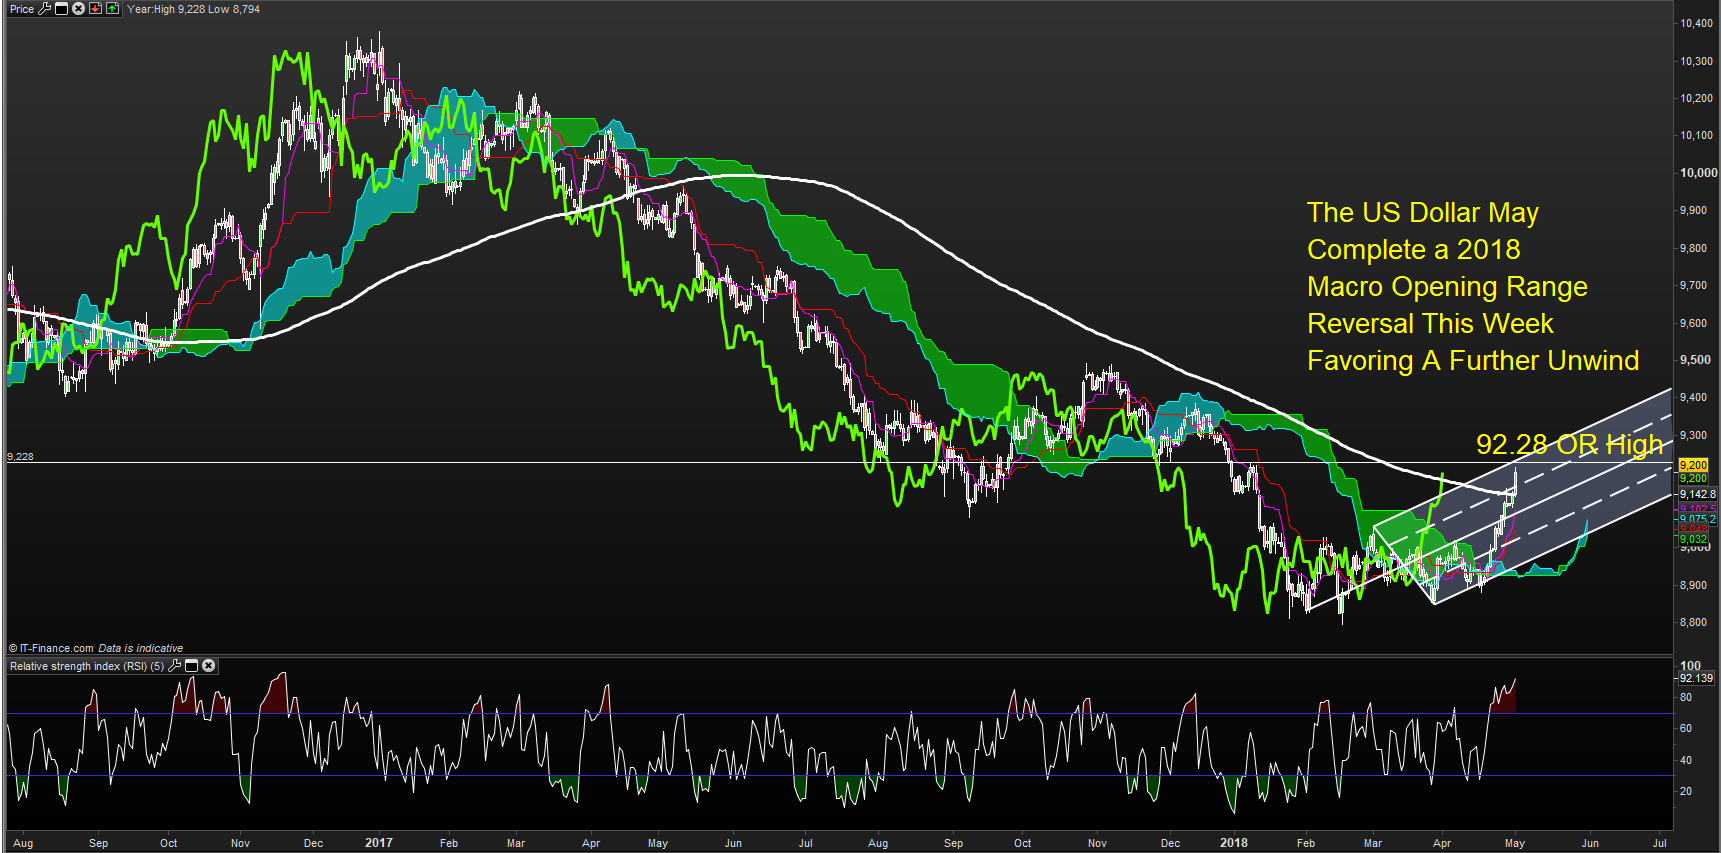
Chart Source: ProRealtime, IG UK Price Feed. Created by Tyler Yell, CMT
The US Dollar has maintained and extended gains at a rate that is surprising many, but should be expected given the multi-year extreme institutional short position on the DXY in favor for now-weak GBP, EUR, & JPY.
A key development worth your attention is the potential move to a 2018 high on the Dollar Index on a break above 92.28. As GBP & EUR break below the 200-DMA and the Japanese Yen continues to fall outside of the Ichimoku Cloud, it’s worth asking how long could this Dollar Bull move last and who stands to lose the most?
Judging by the recent moves, it appears to be those economies susceptible to higher borrowing costs are Emerging Markets, also known as high-beta FX. Other losers to the DXY rally are the non-USD G4 (EUR, JPY, & GBP) as the position unwind aligns with the market’s realization that these CBs aren’t yet ready to join the Fed in the land of tightening above the neutral rate yet.
As always, overbought per RSI(3) doesn’t doubtlessly mean sell nor does oversold RSI(3) doubtlessly mean to buy or go long. Look at the context of the move, and manage your risk.
Looking To Add More To This Analysis? Try IG Client Sentiment
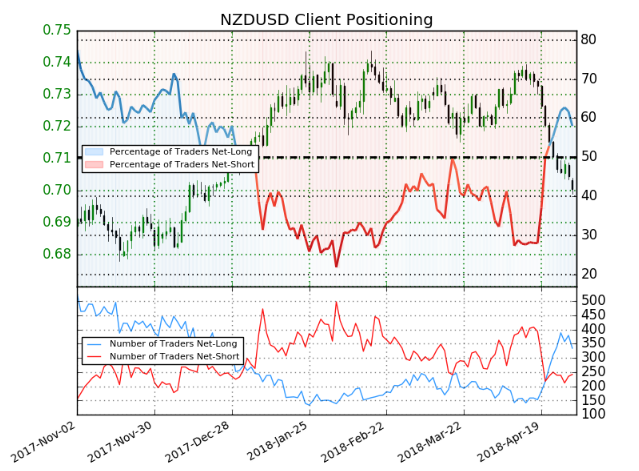
NZDUSD: Retail trader data shows 58.0% of traders are net-long with the ratio of traders long to short at 1.38 to 1. In fact, traders have remained net-long since Apr 22 when NZDUSD traded near 0.71535; price has moved 2.1% lower since then. The number of traders net-long is 17.1% lower than yesterday and 7.1% higher from last week, while the number of traders net-short is 5.7% higher than yesterday and 4.3% lower from last week.
We typically take a contrarian view to crowd sentiment, and the fact traders are net-long suggests NZDUSD prices may continue to fall. Positioning is less net-long than yesterday but more net-long from last week. The combination of current sentiment and recent changes gives us a further mixed NZDUSD trading bias (emphasis mine.)
Access Real-Time Sentiment Analysis Here
Explanation of Columns Above in my Dashboard:
The key column per this report is the RSI(3) column, which is showing the current calculation of the short-term RSI on key currency pairs. The default RSI setting is 14, which makes up nearly 3-weeks of trading data. Naturally, a 3-period RSI is much more sensitive to current moves in the market as opposed to looking over the last 14-days. Short term momentum helps short-term traders find higher probability trading opportunities.
Learn more about using and trading with the Relative Strength Index here
How I Use This Data In My Trading:
Being a fan of trading in the direction of the trend has taught me over the years to look for opportunities at a favorable price to enter in the direction of the trend. When using this data, I am looking for an oversold reading in a well-defined uptrend to identify favorable buying opportunities or an overbought reading in a well-defined downtrend to identify favorable selling opportunities.
Traditionally, a reading above 70 on RSI favors an overbought reading, while a reading below 30 signals an oversold reading. It’s worth noting that reversals are rare, so you want to be as aware of a new normal or trend breakout, as you do an extreme counter-trend reading that may present you an excellent risk-adjusted trading opportunity.
New to FX trading? No worries, we created this guide just for you.
---Written by Tyler Yell, CMT
Tyler Yell is a Chartered Market Technician. Tyler provides Technical analysis that is powered by fundamental factors on key markets as well as t1rading educational resources. Read more of Tyler’s Technical reports via his bio page.
Communicate with Tyler and have your shout below by posting in the comments area. Feel free to include your market views as well.
Discuss this market with Tyler in the live webinar, FX Closing Bell, Weekdays Monday-Thursday at 3 pm ET.
Talk markets on twitter @ForexYell
Join Tyler’s distribution list.


