


EUR/USD, EUR/CHF, EURCAD TECHNICAL ANALYSIS – Talking Points
- EUR/USD and EUR/CAD appear to be treading a sideways path.
- EUR/CHF seems to be looking for a trend but has stalled for now.
- The northern hemisphere summer tamed EUR.Will winter heat things up?

EUR/USD Technical Analysis
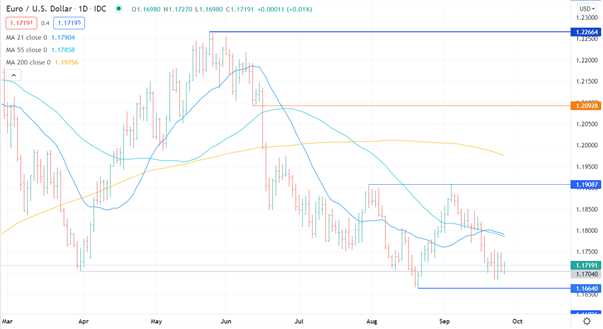
The EUR/USD has been range trading in the 1.1664 - 1.1909 area since July, although there could be some bearish momentum emerging. Three simple moving averages (SMA) across time frames all have a negative gradient.
The 21-day SMA and 55-day SMA are both below the 200-day SMA. However the 21-day SMA is slightly above the 55-day SMA. If the 21-day SMA moves below the 55-day SMA this would be a Death Cross, which is potentially bearish.
The previous low of 1.1664 could provide support, while the previous high of 1.1909 might offer resistance. A break of either level may signal that the range trading environment has finished and a possible trend is emerging.
EUR/CHF Technical Analysis
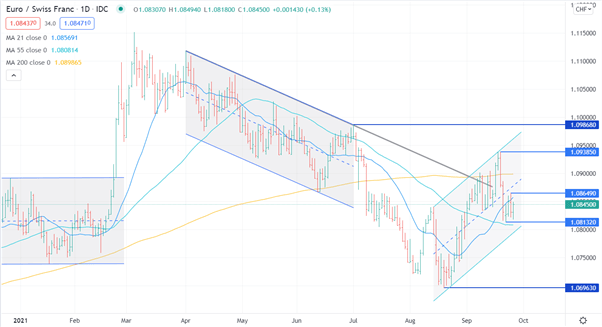
Since making the low for the year at 1.0696 in August, EUR/CHF has managed to establish an ascending trading channel. In doing so it broke through a descending trend line from highs made earlier and overcame the 200-day SMA.
Last week it broke back down through the 200-day SMA, suggesting that upward momentum may have faded. It has traded within the 1.0813-1.0865 range since.
The 21-day SMA has crossed above the 55-day SMA, which could be a bullish signal, but it is yet to cross above the 200-day SMA. This may mean that bearish momentum has abated but we are yet to get a strong bullish signal.
EUR/CAD Technical Analysis
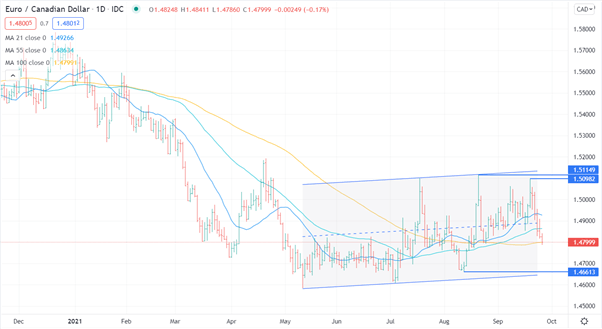
The EUR/CAD cross rate has been caught in a range all through the northern hemisphere summer. The trading channel has a slight ascending bias, but the gradient is very mild.
The order of the 21-day SMA, 55-day SMA and the 100-day SMA is arranged for a potential bullish signal. However, the gradient of the 3 SMAs is relatively flat, which may be suggestive of a neutral bias.
The spot price moved below all 3 SMAs in recent trading sessions, which could indicate that upward momentum has stalled for now.
The EUR/CAD seems to be range-bound until previous lows or highs have been breached. The low at 1.4583 and the high 1.5115 are the outer parameters of the current trading band.
--- Written by Daniel McCarthy, Strategist for DailyFX.com
To contact Daniel, use the comments section below or @DanMcCathyFX on Twitter
Introduction to Technical Analysis
Learn Technical Analysis
Recommended by Daniel McCarthy


