


Talking Points:
- USD/CAD trading above the 1.29 handle after a reprieve on declining Crude Oil Prices
- EIA Crude Oil inventory data is ahead and might induce a sharp reaction for the pair
- 20-day USD/CAD and Crude Oil correlation at -0.87 at the time of writing
The USD/CAD is trading above 1.29 at the time of writing, after the US Dollar managed to recoup some of its losses as the Crude Oil Prices rally came to a stall.
20-day USD/CAD and Crude Oil correlation sites at -0.87 at the time of writing, suggesting that the EIA inventory data ahead might see a sharp reaction from the pair.
Against this backdrop we will form our outlook and look to find short term trading opportunities using different tools such as the Grid Sight Index (GSI) indicator.
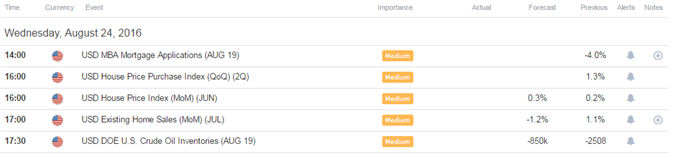
Click Here for the DailyFX Calendar
The official EIA weekly Crude Oil Inventories figure is set to hit the wires 14:30 GMT, and seems like the most likely candidate for USD/CAD volatility. Economists are expecting a -850K decline coming into today, higher than the prior -2508K figure.
With that said, API estimates suggested stockpiles rose by 4.46 million barrels last week, which might imply a surprise rise in the figures today. This scenario could see further Crude Oil selling pressure, which may pressure the Canadian Dollar as well.
US Dollar traders might hold back from fully committing before the Yellen speech this Friday, which could imply that the US housing data may have subdued effects unless a significant deviation from expectations hits the wires.
The probability of a Fed rate hike in December is slowly edging higher, which could potentially see the US Dollar strengthen on pre-positioning to the main event on Friday.
USD/CAD Technical Levels:

Click here for the DailyFX Support & Resistance tool
We use volatility measures as a way to better fit our strategy to market conditions. The USD/CAD is seeing the lowest levels of volatility since December 2015 based on 20-day ATR readings. 1-week implied volatility measures are quite subdued as well.
In turn, this may suggest that range bound trading plays might be appropriate in the short term, but caution is warranted on the EIA data.
USD/CAD 30-Min Chart (With the GSI Indicator): August 24, 2016

(Click to Enlarge)
The USD/CAD is trading slightly above a potential support zone between 1.2920 and 1.29 at the time of writing, with GSI calculating higher percentage of past movement to the upside in the short term.
The GSI indicator above calculates the distribution of past event outcomes given certain momentum patterns. By matching events in the past, GSI describes how often the price moved in a certain direction.
You can learn more about the GSI here.
Further levels of support might be 1.28675, followed by 1.2800, 1.2766 and the 1.27 handle.
Levels of resistance might be 1.2950, 1.2965 and the 1.30 handle.
We generally want to see GSI with the historical patterns significantly shifted in one direction, which alongside a pre-determined bias and other technical tools could provide a solid trading idea that offer a proper way to define risk.
We studied over 43 million real trades and found that traders who successfully define risk were three times more likely to turn a profit.
Read more on the “Traits of Successful Traders” research.
Meanwhile, the DailyFX Speculative Sentiment Index (SSI) is showing that about 59.5% of traders are long the USD/CAD at the time of writing. The SSI is mainly used as a contrarian indicator implying a slight short bias.
You can find more info about the DailyFX SSI indicator here
--- Written by Oded Shimoni, Junior Currency Analyst for DailyFX.com
To contact Oded Shimoni, e-mail oshimoni@dailyfx.com
Follow him on Twitter at @OdedShimoni


