


What’s inside:
- Lower parallel recaptured for now
- Small inverse H&S pattern suggests higher prices in the near-term
- Short-term levels and trades in focus until bigger picture presents better opportunity
The last time we discussed the market, more specifically the S&P 500 (FXCM: SPX500), we noted that buyers needed to step up or step aside. This was based on a lower parallel which held influence over the market as a form of support. The S&P did indeed break the lower parallel and came to the top of the support zone between 2036/21, which almost to the point marked the low on Friday, with the decline halting fractionally below 2036.
Yesterday, in an eventless Monday trading session, the S&P struggled to overcome this prior support turned resistance on a closing daily bar basis. There were repeated attempts to move above intra-day, but ultimately failed to recapture by day’s end with resistance around 2066 putting a lid on any advance.
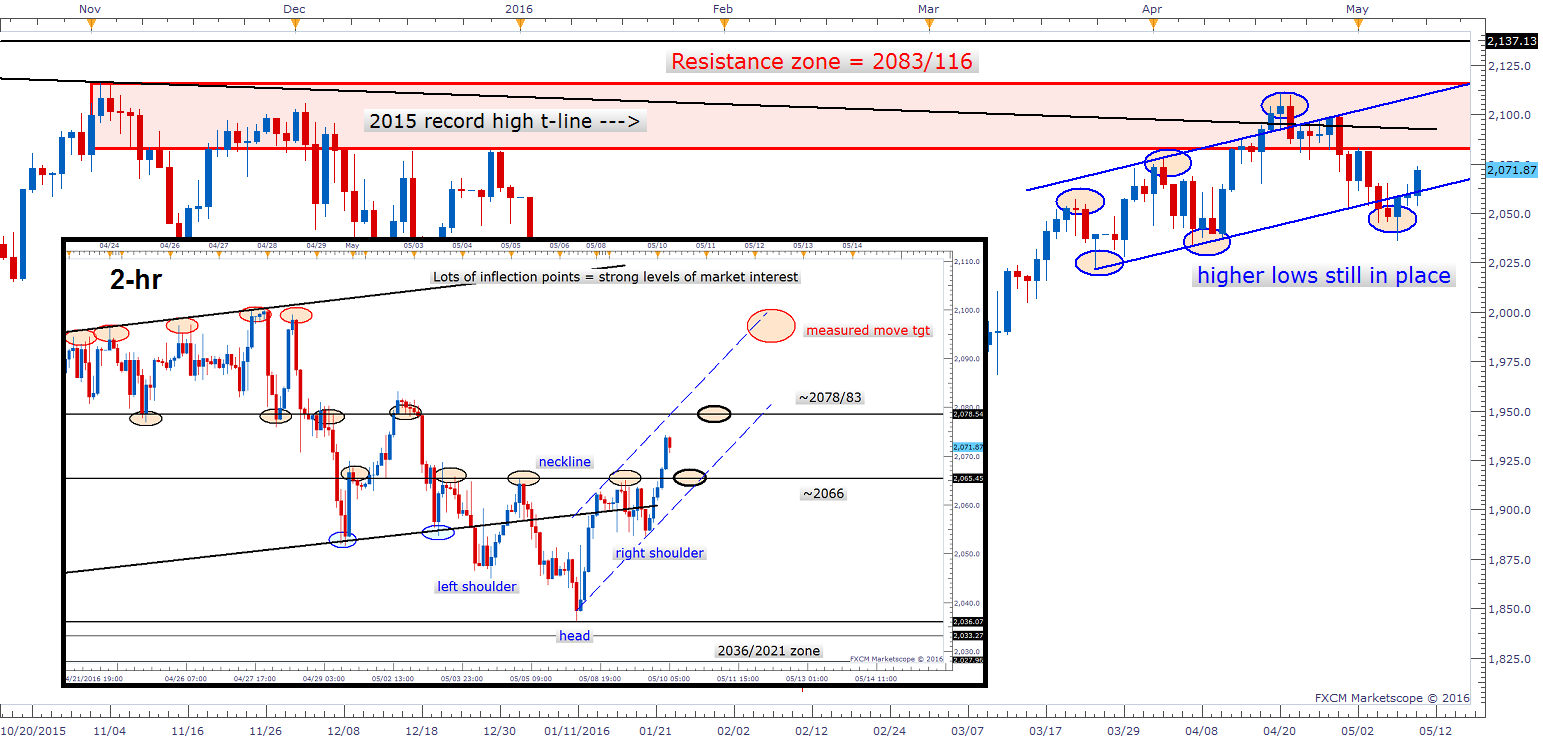
In overnight futures activity we are seeing a solid push above the lower parallel and 2066, which also constitutes the neckline of a little inverse ‘head-and-shoulders’ pattern on the intra-day time-frames. (2-hr shown below.) The break of neckline resistance should see the market a bit higher in the short-term, and with that, we will look to the 2066 area as support and the next zone of resistance in the 2078/83 vicinity. (2083 is the lower end of the broader resistance zone.) The depth of the inverse H&S (~30 points) projects a measured move target of 2095/2100. We will need to see the 2078/83 zone broken first, though.
SPX500 Daily/2-hr
Optimisim on follow-through is limited in either direction at this time. It's a ‘hit-n-run’ type market right now, meaning there are opportunities for the short-term trader, but still lacking any clear set-ups beyond the 1 to 3-day time horizon. That could soon change, but until it does the favored approach on this end is to look for set-ups which yield good risk/reward scenarios when looking out over the very near-term.
Find out what the #1 mistake traders are making.
---Written by Paul Robinson, Market Analyst
You can follow Paul on Twitter @PaulRobinsonFX, or email him directly at instructor@dailyfx.com with any questions or comments.


