


What's inside:
- S&P 500 shrugs off Doha, adds onto gains
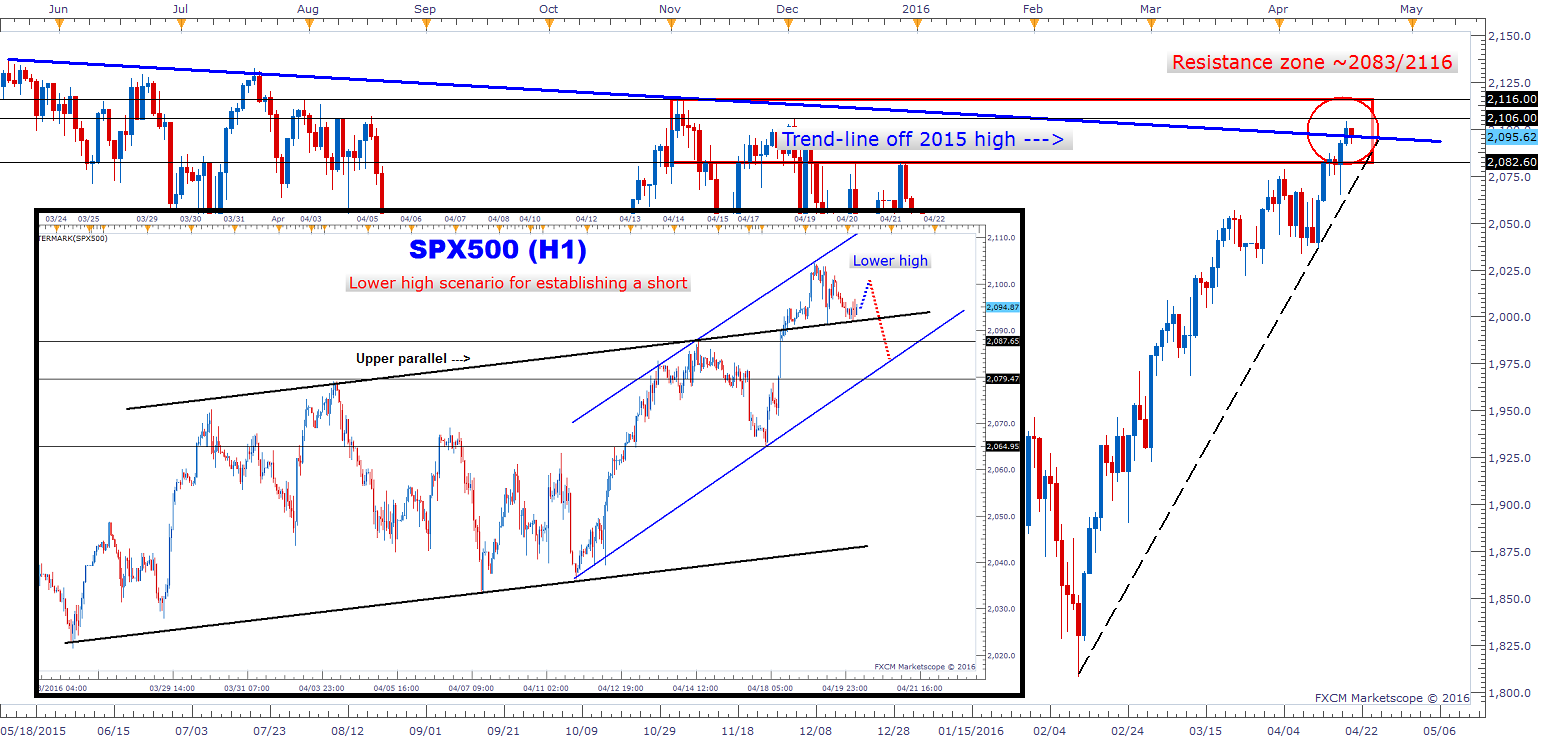
- Recent advance puts it further into critical resistance zone
- Shorts preferred with proper price action
On Monday, we discussed the market's ability to shake off bad news (no Doha agreement) and latch onto the good as one observable sign of current market sentiment. Monday’s rally from overnight futures lows to intra-day cash session highs was impressive; oil of course helped that cause. Additional points were scored yesterday, but with a bit of a struggle. This was to be expected with the S&P rallying 40 handles in a little over 24 hours – further into resistance.
We have been discussing the resistance zone between 2083 and 2116 for a while now; we are right in the thick of it. It makes establishing fresh long positions difficult if looking out beyond a couple of days, but without a good turn in momentum the current trend and willingness by buyers to step in on weakness obviously makes shorting difficult as well.
At this point, though, it is reasonable to expect the market to struggle with all the supply (resistance) at hand, and so while the market is unlikely to fall straight out of the sky, a trade to the down-side could develop in the days ahead. It may only be 20-40 handles in depth, but still a tradeable decline for those traders whose style of trade calls for quick 1 to 2-day type trades.
Looking at the hourly chart: Keep an on eye on the current pullback from yesterday's high and how the market responds to it. A failure to push back to a new high may offer a swing point to reference for risk on a short once the rally begins to fade. An upper parallel the market is currentlly sitting on may offer support, so we would want to see a break below to help further validate any short which may be taken. For 'would-be' bulls, the upper parallel is a short-term 'line-the-sand' for trades aimed towards the upper end of the resistance zone (~2116).
SPX500 Daily/Hourly:
For now, any shorts initiated will be viewed as only ‘quick-hitters’ until the market displays a change in its broad-based bullish character. The area between 2065 (Monday low) to ~2083 (bottom of resistance zone/rising lower channel line) will be watched for signs of buyers stepping back in and we may look at that point to take a ride back higher. Until further big picture clarity, all trades will be kept very short-term in duration on this end.
Looking for medium-term market forecast? Check out one of our guides.
---Written by Paul Robinson, Market Analyst
You can follow Paul on Twitter @PaulRobinsonFX, or email him directly at instructor@dailyfx.com.


