


What's Inside:
- ECB meeting/press conference set to spark volatility
- Don't force the trade, a clean set-up will present itself with a little patience
- Upward trend remains well intact, S&P 500 and Dow face resistance ahead
ECB front and center
Later today at 12:45 GMT time the ECB will release its decision on monetary policy, with a press conference to follow at 13:30. No predictions will be made on this end, and to be perfectly honest there will be a sigh of relief once today is over as trading can return back to ‘normal’. The December 3rd meeting brought massive volatility across the board, spiking the euro over 400 points while sinking European and US stock markets. It is unlikely we see the same level of volatility, but we should be prepared for sizable gyrations. Scalpers should be able to find opportunity amidst the swings. The larger moves will be in the European indices, with the US reacting.
Don't force the trade
Here is a little nugget of advice to think about as we head into today’s event – if you aren’t sure what you want to do, then do nothing. Indecision is a decision. You don’t want to get caught leaning the wrong way in an effort to ‘catch the move’. It’s the everyday trading which over time gets us to our long-term goals, not these one-off events. Be patient.
With that said, now let’s move on to the current, but about to change, technical structure in us stock indices.
Trend support continues to keep market pointed higher
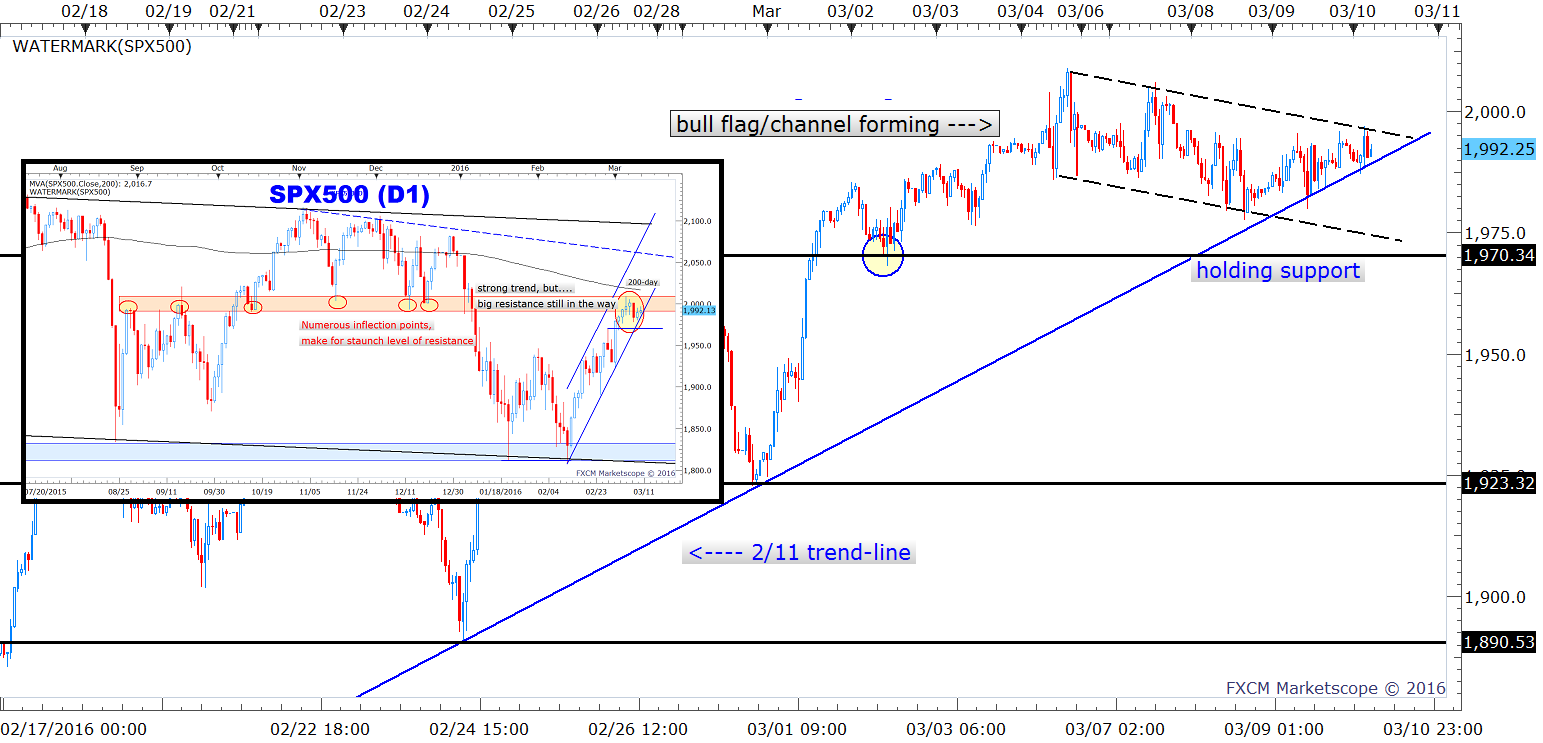
Yesterday, the S&P 500 and Dow successfully held their respective trend-lines extending back to the 2/11 low. As long as these lines hold then the current trend integrity will be maintained, but should it give way to selling pressure then we will need to focus on 1970 and 16920 in the S&P and Dow, respectively. Below there and the short-term picture turns a bit upside down with potential for a further decline to ensue.
Resistance ahead, breadth suggests we move through
On further strength just ahead we have the 2000 and 17100 area to watch as resistance. On the hourly chart the S&P has a bull-flag/channel forming while the Dow has a wedge nearly ready to trigger. The trend higher off the lows has been strong in terms of price and breadth, leading us to believe we could advance above resistance at some point. A clear rejection and break of before mentioned support levels would put this notion on hold.
The Nasdaq 100 continues to lag, but should the other two indices take out resistance then the tech-heavy index will follow suit. Big picture resistance isn't until between 4420 and 4500. The Nasdaq may be the go-to index to short should sellers step given its relative weakness.
S&P 500 Hourly (Daily)
Dow Hourly (Daily)

For today, we will sit back and wait and see how the market responds post-ECB and take it from there. Sharp reactions could very well muddy up the charts and we will have to reasses. But a cleaner trading environment soon awaits us.
To learn more about how to become a more successive trader, check out our 'Traits of Successful Traders' guide.
---Written by Paul Robinson, Market Analyst
You can follow Paul on Twitter @PaulRobinsonFX, or email him directly at instructor@dailyfx.com with any questions, comments, or concerns.


