


Highlights:
- Pullback as expected from resistance, support now the focus
- Giving trend strength higher the benefit of the doubt, but the 2000 area is formidable
- Hourly chart showing developments which could soon offer opportunity
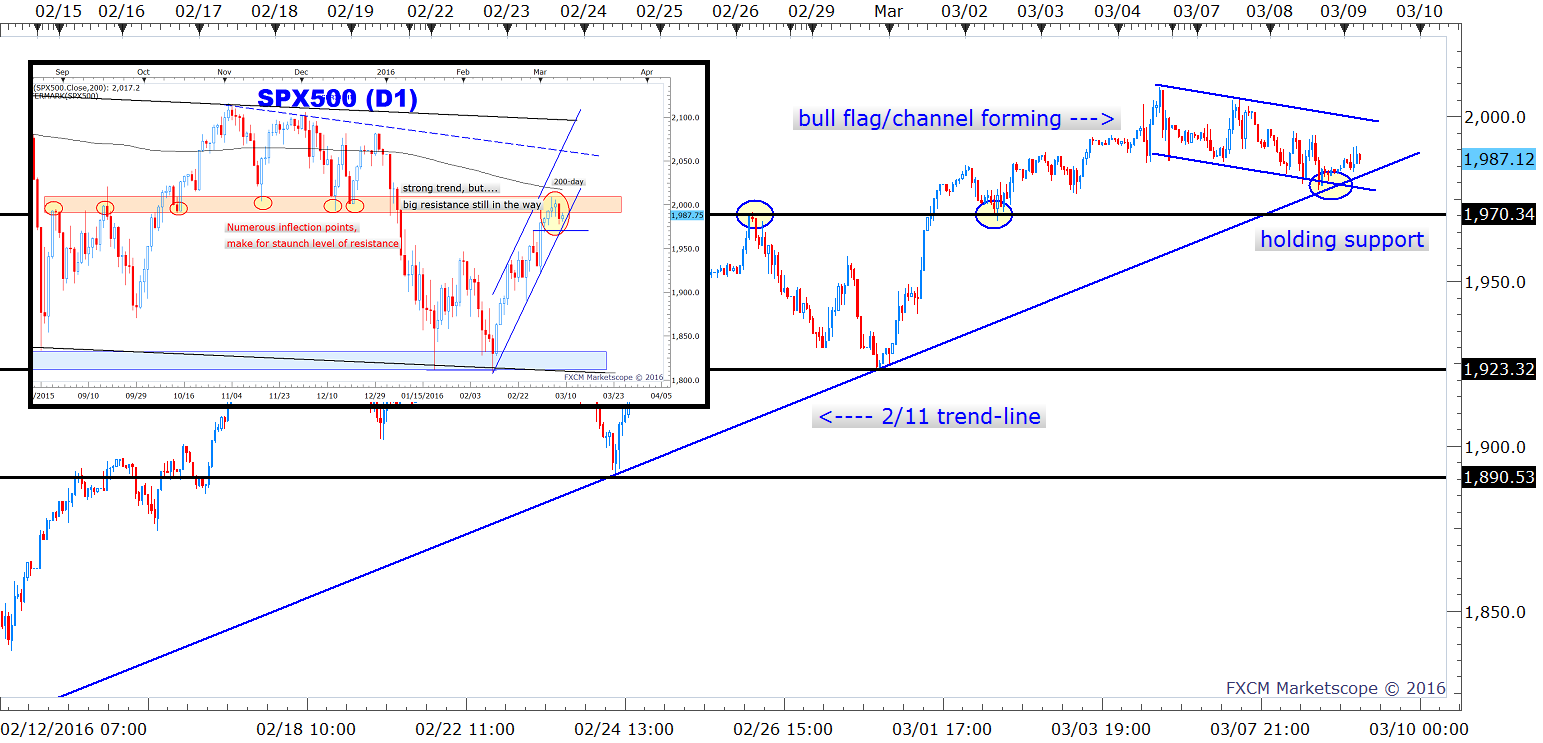
The S&P 500 has been pulling back from the 2000 area as one would expect with the market overbought into resistance. This now has the trend-line off the February 11 low squarely in focus. As we head into the thick of today’s trade the S&P continues to hold the line of support, but should it break we will to look to 1970 as the last line of short-term defense for the longs.
If both trend and horizontal support levels are taken out then the pullback could become more hostile, making the area just below a sort-of make or break spot for the very near-term. The current landscape of support presents traders with a low-risk opportunity to join the month-long trend higher, but with any long position established we must continue to keep the 2000 area in mind given its size. This makes things a little tricky at the moment.
While momentum in both price and breadth suggests resistance should give way to higher prices at some point, the fight could take some time. The overbought breadth readings we examined yesterday have subsided a bit, but certainly could retreat a bit more without becoming worrisome. With that said, a period of consolidation could be in order before a push to new higher grounds commences.
The hourly chart shows a channel/bull-flag developing which is not readily visible on the daily chart. A hold of rising trend support coupled with a break of the top-side parallel could lead to a break through the wall of resistance, but until we actually clear resistance any long positions established will need to be closely monitored as the possibility of failure in this area remains elevated. If you do not believe in this rally and are looking to establish a swing position for a renewed leg of weakness, the 2000 area remains an attractive spot to establish a short given the repeated number of inflection points dating back to last year.
S&P 500 Hourly (Daily)
Want to take your trading to the next level? Find out what characteristics successful traders commonly have.
---Written by Paul Robinson, Market Analyst
You can follow Paul on Twitter @PaulRobinsonFX, or email him directly at instructor@dailyfx.com with any questions, comments, or concerns you may have.


