


To receive James Stanley’s Analysis directly via email, please sign up here.
Talking Points:
- Gold Technical Strategy: Flat, long setup stopped-out after FOMC with close below $1,155
- Continued weakness in Gold has brought prices down to a projected trend-line from the July lows.
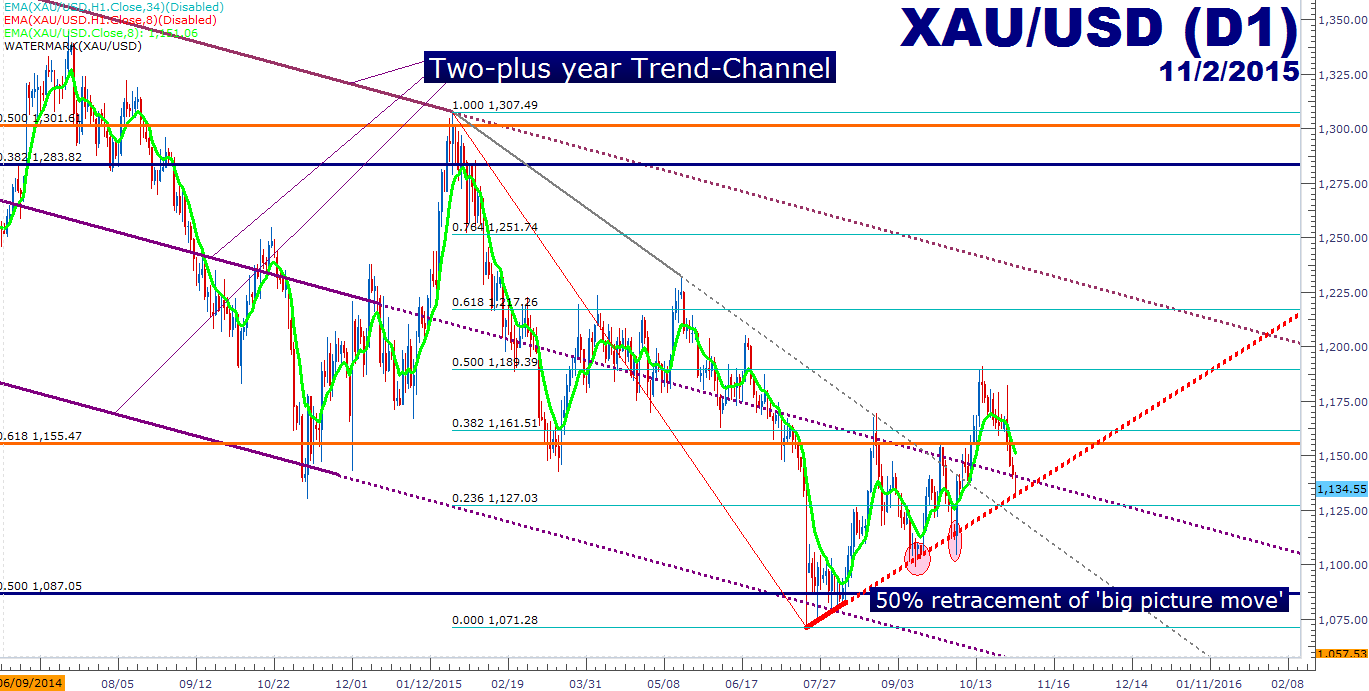
- The longer-term bearish trend-channel is still active, and prices just crossed the mid-line of that channel, opening the door for a potential return of the ‘bigger-picture’ down-trend.
In our last article, we looked at a continued long setup in Gold as Gold prices continued to collect at support after breaking out to a new short-term high in the $1,190 area. This support had come in at a relevant Fibonacci level of $1,161 that is the 38.2% retracement of the most recent major move, taking the 2015 high to the 2015 low of $1,071.28. With a longer-term support level at $1,155.47, the 61.8% Fibonacci retracement of the ‘secondary move’ in Gold, taking the 2008 low to the 2011 high. This presented the opportunity for continued long setups with stops below that $1,155 support zone and targets cast towards the previous swing-high at $1,189 (which is also the 50% retracement of the most recent major move).
But a hawkish Federal Reserve on Wednesday of last week sent Gold prices reeling, plummeting through multiple areas of support, seeing both $1,161 and $1,155 give way as traders began to price in a faster-than-expected rate hike from the Fed. Gold prices found temporary relief to close the week, catching support on the projected mid-line of the bearish trend-channel (shown in purple on the below chart) that’s set the tone in Gold for the better part of over 2 years. But continued weakness to open the week has sent prices even further lower, and another trend-line projection is coming into play that could set the stage for setups going into this week.
The trend-line in question (shown in red on the below chart) can be found by connecting the yearly low in Gold that was set on July 20th to the swing low on August 7th. By connecting these lows, you’ll notice the accompanying price action ride almost perfectly along this trend-line between these two dates. But perhaps more encocuraging, you’ll notice the continue support as this trend-line had projected deeper into the future. We saw another reaction to this trend-line in mid-September, and again in early October (noted with red circles in the below chart). This morning’s price action has seen gold prices move down to this trend-line yet again, and this could provide the motive for future long positions. Traders can elect to wait for support to develop to ensure that prices don’t continue their precpitious drop right into the trader’s stop. The level of $1,125 looks especially attractive for stop placement. $1,127.03 is the 23.6% retracement of the most recent major move, and given its close proximity to the $1,125 psychological level, traders could look to set stops below this potential zone of support with targets cast towards those familiar levels of $1,150, $1,155, $1,161, and then $1,190.
Alternatively, short positions are faced with the challenge of chasing near-term downward-momentum that leaves current price action far from any recent swing-highs. The most recent swing-high on the daily chart is at $1,182, and this would be a roughly $50 stop. That would necessitate price action moving below $1,084 simply to attain a 1-to-1 risk-to-reward ratio. That can be unattractive considering the numerous support zones that would need to be broken simply to justify a 1-to-1.
Traders could take a more cautious approach concerning near-term short positions in Gold, waiting for a continued break below this projected trend-line (in red), or by allowing price action to move closer to a previous support zone (such as $1,155 or $1,161), so that a short position could be triggered with a stop above the previous swing-high, and a more justifiable target at $1,100.
Should $1,100 give way, $1,087.05 becomes a level of interest, as this is the 50% retracement of the ‘big picture’ move in Gold, taking the low in 1999 at $253.30 to the 2011 high at $1,920.80. Notice the massive amount of support that had come in at this level in latter July. Price moved higher by over $100/ounce since this level came into the market, but these lows helped to set the angle of the projected trend-line that’s coming into Gold’s price action right now. Should we break this trend-line, these lows are in play.
Created with Marketscope/Trading Station II; prepared by James Stanley
--- Written by James Stanley, Analyst for DailyFX.com
To receive James Stanley’s analysis directly via email, please SIGN UP HERE
Contact and follow James on Twitter: @JStanleyFX


