


To receive James Stanley’s Analysis directly via email, please sign up here.
Talking Points:
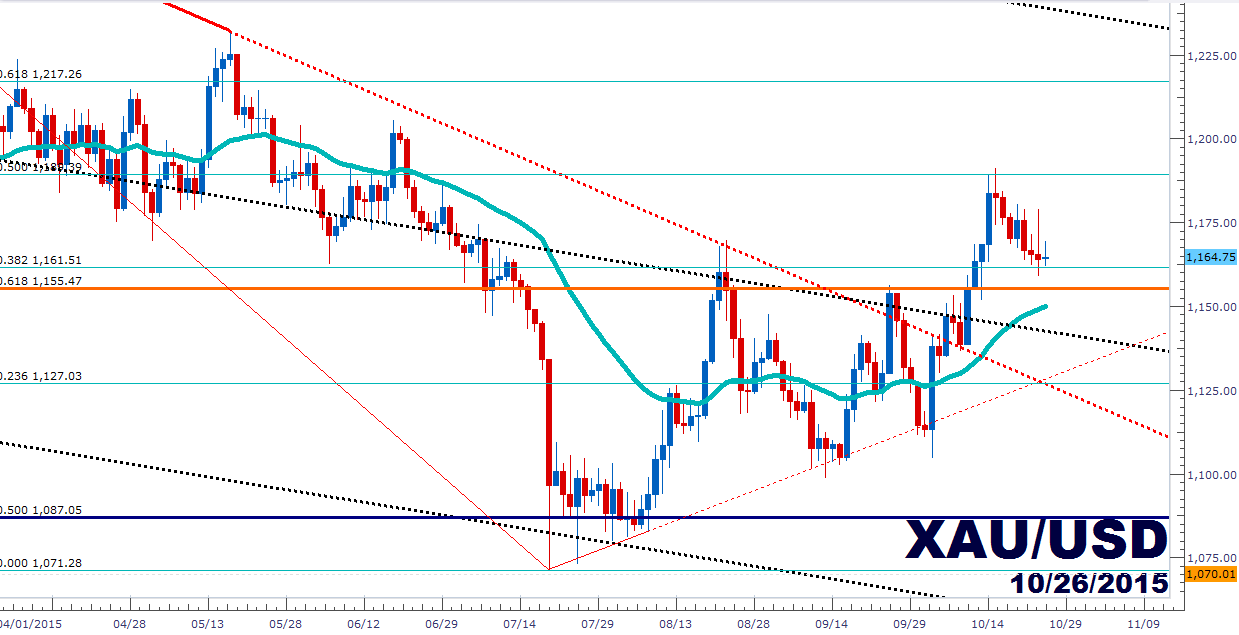
- Gold Technical Strategy: Flat, long setup still active until a daily close below $1,155
- Gold has continued to catch support in the $1,161 area; continuing to pose a bullish near-term stance.
- The longer-term bearish trend-channel remains active, but the top-side of this channel doesn’t come into play until $1,238
In our last article, we looked a long setup in Gold after prices had come down from a new near-term high was set in $1,190 region. This was a relevant level, as it’s the 50% Fibonacci retracement of the most recent major move, taking the 2015 high at $1,307.49 to the 2015 low of $1,071.28. And within 24 hours of publishing, it looked like that setup was going to work beautifully as prices had already moved up to $1,180 and it looked as if the first target at $1,189 was going to be quickly cashed-in. But alas, that movement did not continue; and since then we’ve seen prices gyrate lower.
The aggressive stop at $1,161 (which is the 38.2% Fibonacci retracement of the most recent major move) has been taken out with an intra-day swing on Friday of last week. But prices quickly recovered and support has come in north of this level, with the more conservative stop below $1,155 remaining respected. As long as prices remain above this ‘line-in-the-sand,’ the bullish side of gold looks more illustrious. $1,155 is the 61.8% Fibonacci retracement of the ‘secondary move’ in Gold, which is taking the 2008 low to the 2011 high. This is a price that’s seen considerable price action since the major move’s formation, testament to the fact that numerous traders are watching these longer-term techincal studies (and thusly, reacting to them).
The more attractive near-term setup remains on the long side until $1,155 gets taken out with a daily close. With this, traders can look at lodging stops below this $1,155 level, and for those wanting to take an even more conservative stance – they can aim stops further south below the $1,150 psychological level. This could open the door for profit targets at $1,189 (the 50% Fib retracement of the most recent major move), $1,200 (psychological level), $1,217 (61.8% of the most recent major move), $1,225 (minor psychological level), and then $1,238 (projected down-ward sloping trend-line that’s been active for over two years).
The primary goal of a long position in Gold would be to stay alive in the trade to get to Wednesday’s FOMC announcement; and if the Fed does, in fact, take on a more dovish tone towards a 2015 rate hike (perhaps even mentioning that a hike in 2015 is likely off-the-table), traders can watch Gold jump higher on the premise of ‘looser for longer.’
Alternatively, the short side in Gold could be difficult in the immediate future given the distance from recent swing-highs. With the October high being more than $28 away from current prices, a justifiable risk-reward ratio could be hard-to-find with the given setup. Traders looking to take a short Gold position could either a) wait for prices to move closer to the $1,189 swing-high so a more attractive stop could be set or b) let prices break below $1,155 to prove that sellers might be able to take control in the near-term. If $1,150 gets breached, attractive levels could be seen at $1,127 (the 23.6% Fibonacci retracement of the most recent major move), $1,100 (psychological level, and previous price action swing-low), $1,087.50 (the 50% Fibonacci retracement of the ‘big picture move,’ taking the 1999 low to the 2011 high), and then $1,071.28 (the 2015 low in Gold prices).
Created with Marketscope/Trading Station II; prepared by James Stanley
--- Written by James Stanley, Analyst for DailyFX.com
To receive James Stanley’s analysis directly via email, please SIGN UP HERE
Contact and follow James on Twitter: @JStanleyFX


