


Dow Jones, Nikkei 225, Hang Seng, US CPI, China Lockdowns, Technical Analysis – Asia Pacific Indices Briefing
- Dow Jones, Nasdaq 100, S&P 500 soared to start off the new trading week
- Traders might be pre-positioning themselves ahead of Tuesday’s US CPI
- Japan’s Nikkei 225 and Hong Kong’s Hang Seng Index might aim higher

Monday’s Wall Street Trading Session Recap
Sentiment continued improving from last Friday to start off the new trading week. The S&P 500 wrapped up its 4th consecutive daily gain, the longest winning streak since early July. Looking at Wall Street’s performance, the Dow Jones, Nasdaq 100 and S&P 500 climbed 0.72%, 1.21% and 1.09%, respectively.
A lack of economic event risk, as well as the Fed’s blackout period until September’s interest rate announcement, likely had traders placing bets ahead of tomorrow’s highly anticipated CPI report. The headline rate is seen weakening to 8.1% y/y in August from 8.5% prior as the core rate picks up to 6.1% from 5.9%.
Better-than-expected US data last week, such as ISM services and jobless claims, might have traders looking forward to some economic resilience in the face of aggressive monetary tightening. You can see some of this by looking at the highly watched 10- & 2-year yield curve. While it remains inverted, the spread has been slowly rising for a month as longer-term Treasury yields outpace short-end rates.
S&P 500 Sector Breakdown 9/12/2022
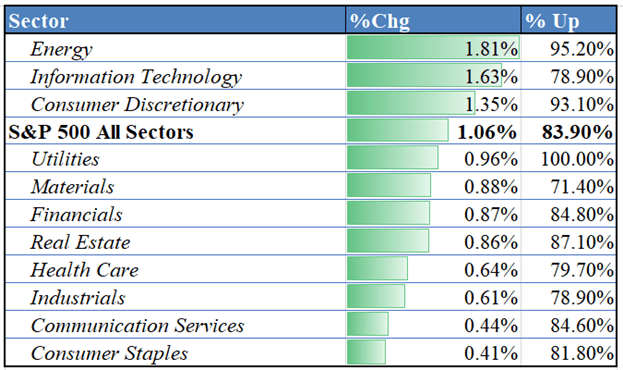
Data Source: Bloomberg, Chart Prepared by Daniel Dubrovsky
Dow Jones Technical Analysis
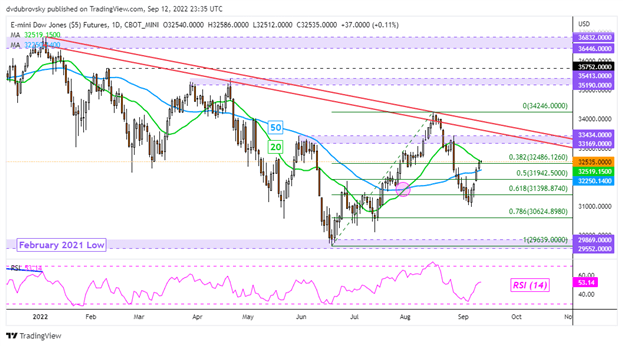
Dow Jones futures are sitting just under the 20-day Simple Moving Average (SMA). Breaking above this key resistance could open the door to extending gains, placing the focus on the falling trendline from early January. Otherwise, a turn lower back under the 50-day line could hint at further losses, exposing the early September low.
Dow Jones Futures Daily Chart
Tuesday’s Asia Pacific Trading Session
Taking into consideration the rosy session on Wall Street, Tuesday’s Asia Pacific trading day could enjoy a positive start. Outside of Australian consumer and business confidence, the APAC economic docket is light today. That could result in trading being largely influenced by general risk appetite. As such, Japan’s Nikkei 225 and Hong Kong’s Hang Seng Index could look forward to a rosy session.
China remains a wildcard due to the potential for sporadic Covid-induced lockdowns. According to Bloomberg, a key media school in Beijing was put under strict quarantine last Friday. On Sunday, officials noted that the outbreak should be contained in the “shortest period of time”. This is as the megacity of Chengdu remains in lockdown.

Nikkei 225 Technical Analysis
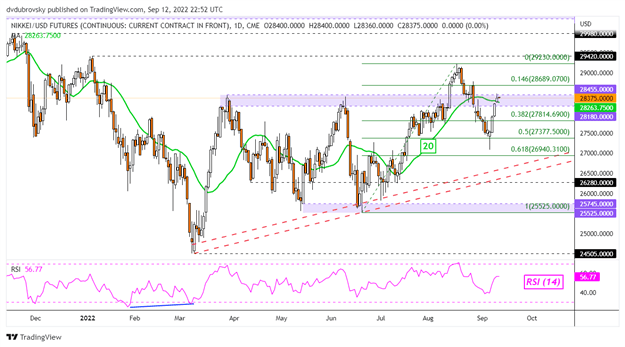
The Nikkei 225 pushed above the 20-day SMA over the past 24 hours. Confirming the breakout, as well as a push above the 28180 – 28455 inflection zone, may open the door to extending gains towards the August high at 29320. Otherwise, immediate support appears to be the 38.2% Fibonacci retracement at 27814.
Nikkei 225 Daily Chart
Hang Seng Technical Analysis
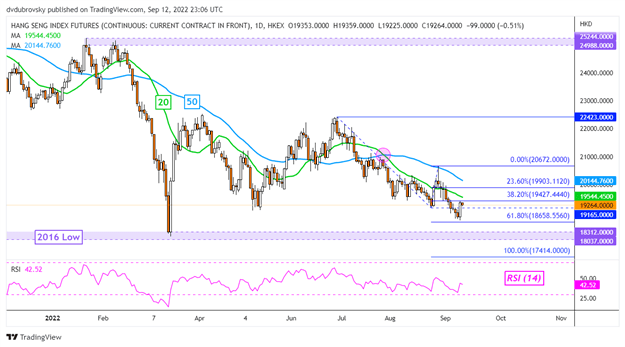
The Hang Seng Index soared 2.72% last Friday and trading was closed on Monday due to the Mid-Autumn Festival holiday. Prices still sit below the 20-day SMA, which could hold as resistance and maintain the downside focus. Otherwise, breaking higher exposes the 50-day line. In the event of a turn lower, key support appears to be the 61.8% Fibonacci extension at 18658.
Hang Seng Daily Chart
--- Written by Daniel Dubrovsky, Strategist for DailyFX.com
To contact Daniel, use the comments section below or @ddubrovskyFX on Twitter
Trade Smarter - Sign up for the DailyFX Newsletter
Receive timely and compelling market commentary from the DailyFX team


