


Gold Price (XAU/USD), Chart, and Analysis
- Gold may slip back below $1,700/oz.
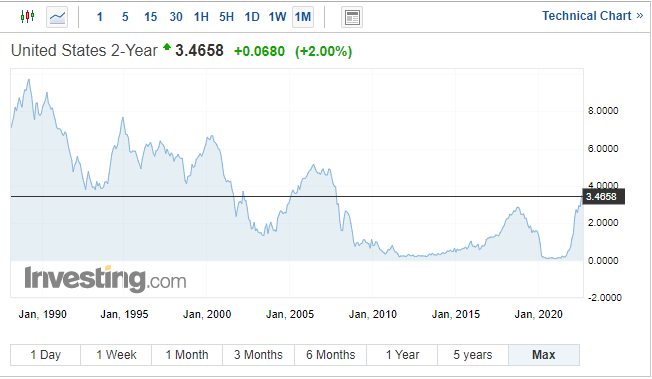
- US Treasury yields remain elevated.
- Retail traders continue to increase their net-long positions.

The recent sell-off in the precious metal is taking a breather after testing, and rejecting sub-$1,700/oz. levels at the end of last week. US Treasury yields remain at elevated and multi-year high levels, while the US dollar continues to hit peaks last seen over two decades ago. US dollar strength is also being supported by Euro weakness as the indefinite closure of the Nord Stream pipeline threatens European energy supplies.
The interest-rate sensitive UST 2-year is currently offered with a yield of just under 3.50%, a level last seen over 15 years ago. While this yield is unlikely to move noticeably higher, it is expected to remain at the current elevated level for the coming months as the Fed continues its fight against inflation.
The Fed is expected to hike rates by a further 75 basis points later this month, taking the target rate to 300bps - 325bps, and further increases are expected in the coming months to take the target rate to 375bps-400bps by late this year to early next year. The rest of this week is littered with Fed speakers, including Jerome Powell on Thursday, and their comments will need to be followed closely for any clue about the expected path of inflation in the months ahead.
Trade Smarter - Sign up for the DailyFX Newsletter
Receive timely and compelling market commentary from the DailyFX team
For all market-moving data releases and events, see the DailyFX Economic Calendar.
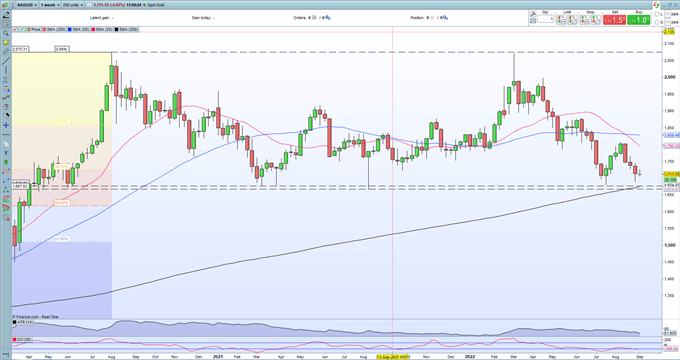
The weekly gold chart shows the precious metal under pressure and likely to re-test the $1,700/oz. ‘bi figure’ support level. This support may not hold any sell-off, leaving a zone of support between $1,667/oz. and $1,677/oz. vulnerable. Below here, the 50% Fib retracement at $1,618/oz. comes into play.
Gold Weekly Price Chart – September 6, 2022
Retail trader data show 85.70% of traders are net-long with the ratio of traders long to short at 5.99 to 1. The number of traders net-long is 2.44% higher than yesterday and 13.29% higher from last week, while the number of traders net-short is 8.55% lower than yesterday and 24.81% lower from last week.
We typically take a contrarian view to crowd sentiment, and the fact traders are net-long suggests Gold prices may continue to fall.Traders are further net-long than yesterday and last week, and the combination of current sentiment and recent changes gives us a stronger Gold-bearish contrarian trading bias.
| Change in | Longs | Shorts | OI |
| Daily | 1% | -3% | -1% |
| Weekly | 2% | -8% | -2% |
What is your view on Gold – bullish or bearish?? You can let us know via the form at the end of this piece or you can contact the author via Twitter @nickcawley1.


