


Bitcoin, Ethereum Talking Points
- Bitcoin (BTC/USD) rejected by $25,000 psychological level
- China’s strained economy supports USD strength
- Ethereum (ETH/USD) six-week rally stalls as merge hype subsides

Bitcoin (BTC/USD) Technical Analysis
The return of risk-on sentiment supported last week’s crypto rally that allowed Bitcoin to retest $25,000. After rising to a two-month high, failure to gain traction above psychological resistance resulted in an increase in selling pressure, muting the upward move.
Discover 3 Key Tips for Trading Cryptocurrency
With momentum stalling at key technical levels, another big week of high-impact economic data may assist in the catalyzation of price action throughout the crypto sphere.
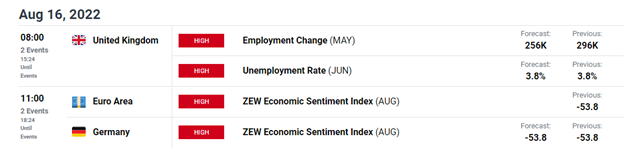
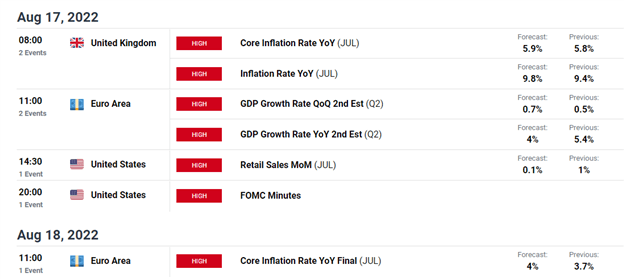
DailyFX Economic Calendar
Learn How to Read a Forex Economic Calendar
To further illustrate the importance of the current zone, short-bodied candles on the daily chart highlight Fibonacci levels providing additional levels of support and resistance. With the 76.4% retracement of the March – June move holding bulls at bay at $424,790, the 20-day MA (moving average) has formed support at $23,549 with a break below reopening the door for $20,000.
Bitcoin (BTC/USD) Daily Chart
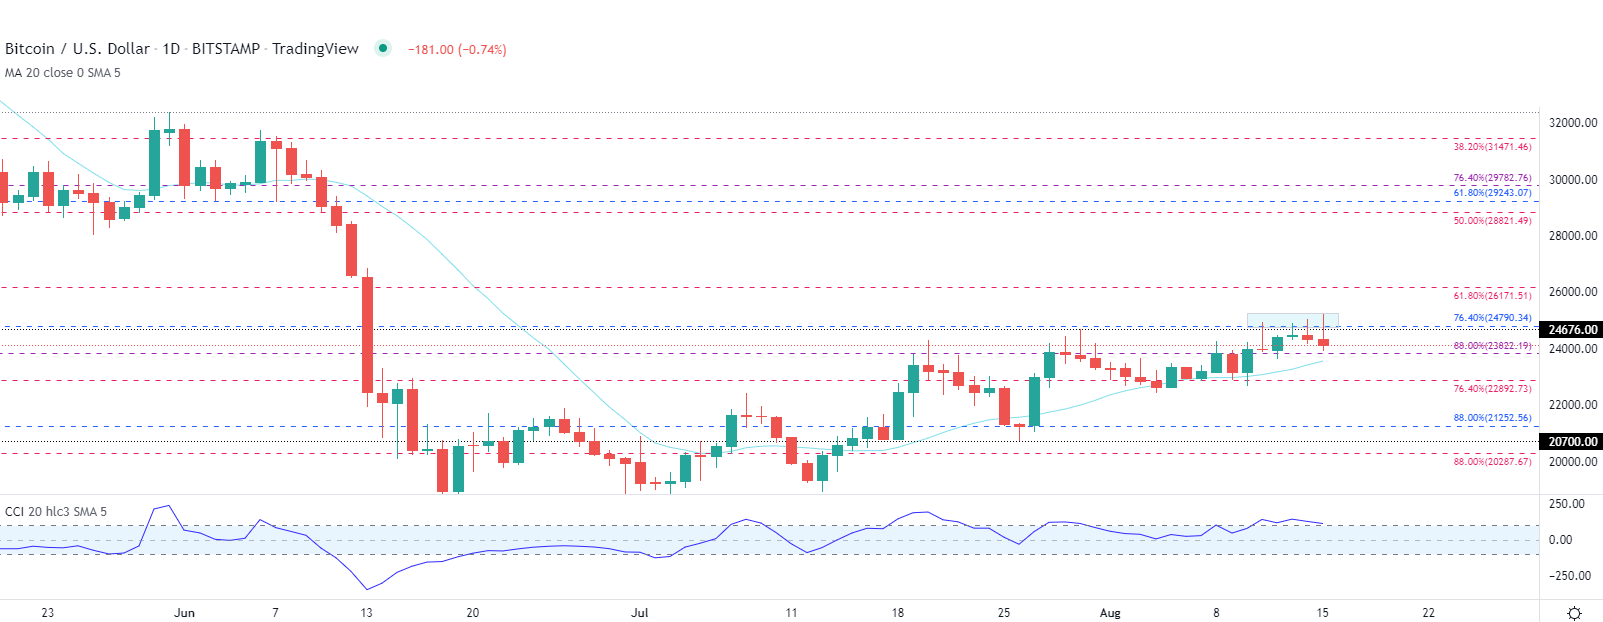
Source: TradingView, Chart by Tammy Da Costa

On the eight-hour chart, the rising trendline currently remains intact with the long wick candle forming a potential hanging man (a bearish reversal pattern).
Bitcoin (BTC/USD) 8 Hour Chart
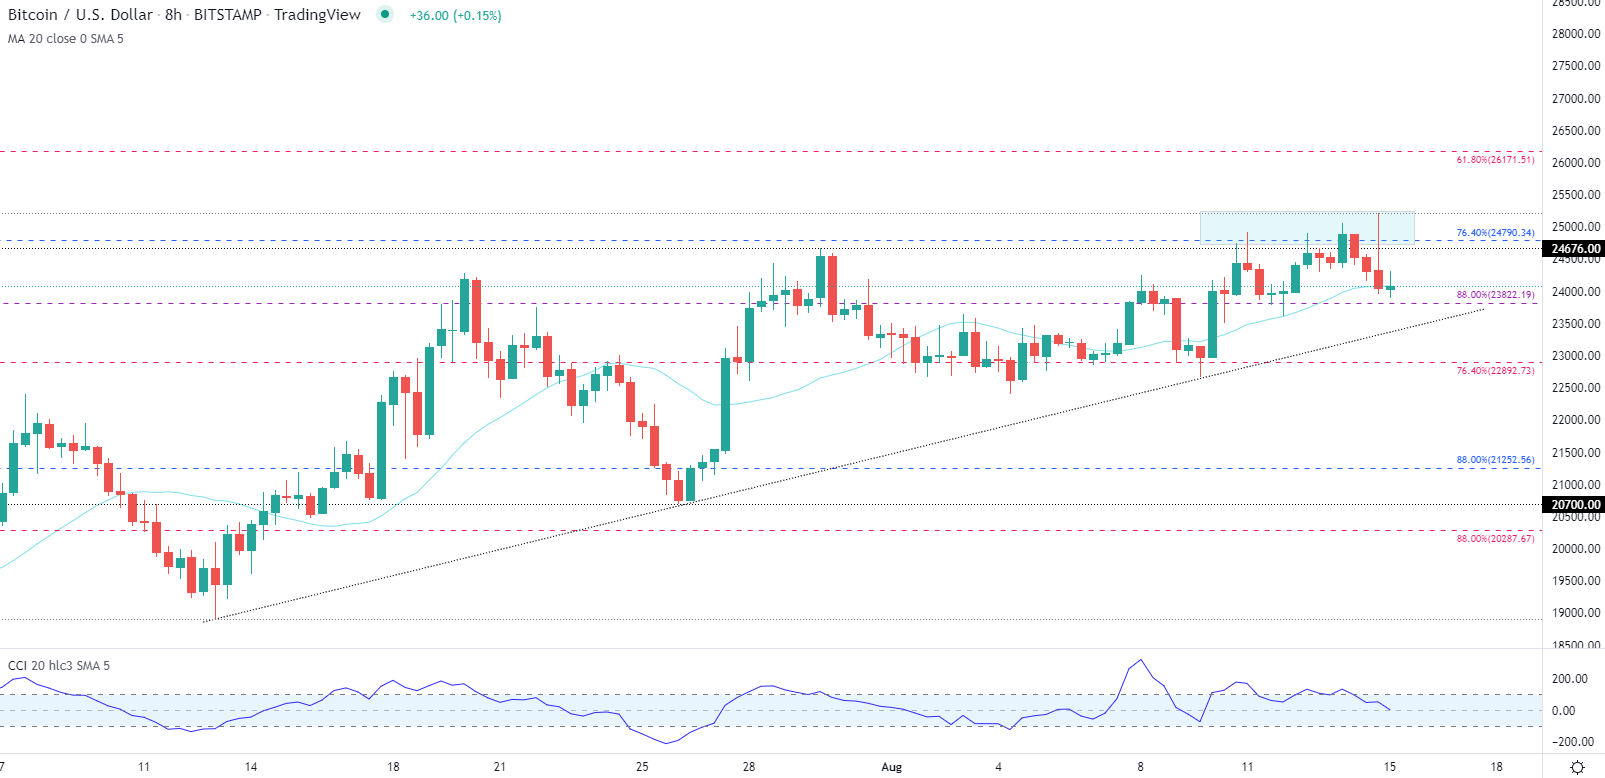
Source: TradingView, Chart by Tammy Da Costa
Bitcoin Key Levels:
| Support | Resistance |
|---|---|
| $23,822 | R1: $24,790 |
| $22,892 | R2: 25,000 |
| $21,52 | R3: 26,171 |
Ethereum (ETH/USD) Technical Analysis
Meanwhile, for the second largest cryptocurrency, Ethereum gained approximately 13.8% before hitting a barrier of resistance at $2,000. With ETH 2.0 expected to debut next month, the transition to a more energy efficient Proof of Stake (PoS) added to optimism, fueling the upward move.
On the weekly timeframe, the narrow range between $1,912 and $2,000 is indication of a battle between bulls and bears that are fighting for dominance.
Ethereum (ETH/USD) Weekly Chart

Source: TradingView, Chart by Tammy Da Costa

After six consecutive weeks of gains, the CCI (commodity channel index) remains in overbought territory with a move lower suggesting that bullish momentum may be losing steam.
Ethereum (ETH/USD) Daily Chart
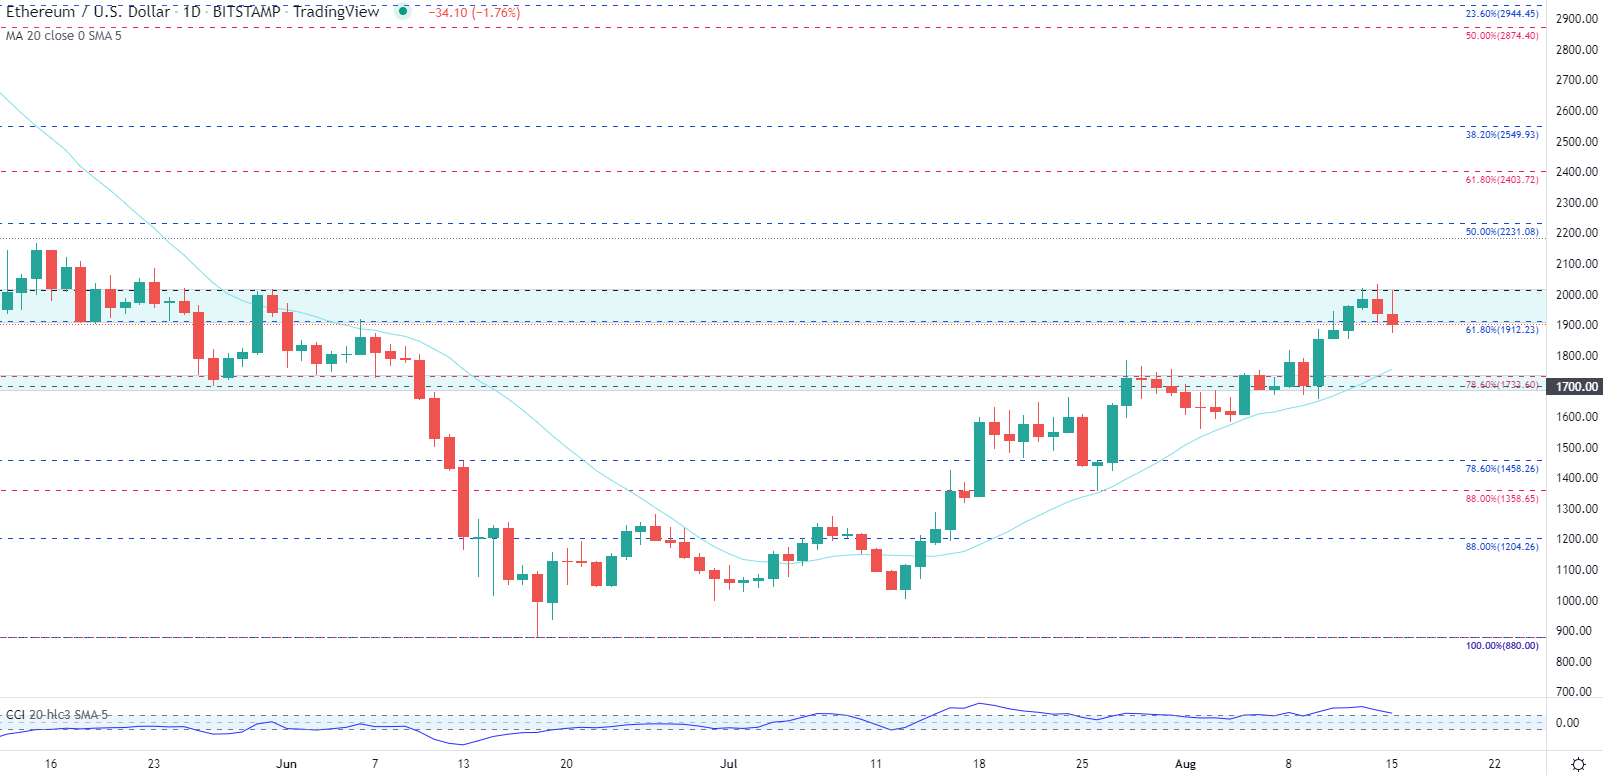
Source: TradingView, Chart by Tammy Da Costa
--- Written by Tammy Da Costa, Analyst for DailyFX.com
Contact and follow Tammy on Twitter: @Tams707


