


- DAX 40:Higher as Global Sentiment Improves.
- FTSE 100:Gains as UK Earnings Filters Through.
- DOW JONES:Cautiously Higher as Bank Earnings Continue.
What is Earnings Season and What to Look for in Earnings Reports?
DAX 40: Higher as Global Sentiment Improves
The Dax traded higher in European trade ending a difficult week on a positive note reaching a session high of 12773. Fears of a global economic slowdown have plagued stock markets for much of this week. According to economists at Deutsche Bank, Europe’s largest economy is headed for a recession and will shrink by about 1% in 2023. Declining natural gas supplies, a downturn in the US and other headwinds will cause Germany to contract in the second half of this year which could have negative implications on the constituents of the index.
Green dominates the sectoral breakdown with consumer cyclicals and industrials posting gains of 2.8% and 2.3% respectively.
DAX 40 Daily Chart - July15, 2022
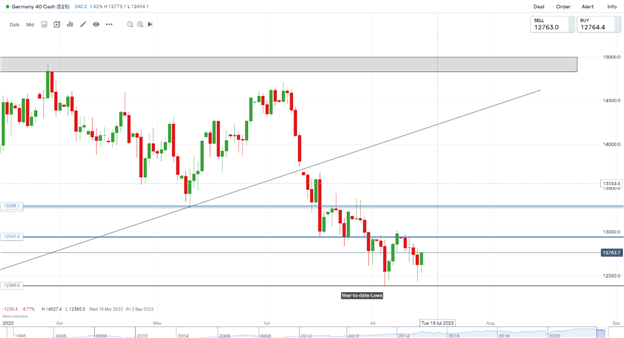
Source: IG
From a technical perspective, we continue to trade below the psychological 13000 level having come close to the year-to-date lows.
Yesterday’s daily candle closed as a hanging man candlestick, however we have since bounced aggressively. An end of the week recovery rally may reach the low of 23 June at 12839 which may provide some resistance. Slightly further up sits the mid-June low at 12944 which may also act as resistance, together with the more significant psychological level 13000 high from last Friday which may be the best opportunity for would-be-sellers to get back involved.
Key intraday levels that are worth watching:
Support Areas
- 12550
- 12386
- 12000
Resistance Areas
- 12944
- 13300
- 13620
Trading Strategies and Risk Management
Global Macro
Recommended by Zain Vawda
FTSE 100: Gains as UK Earnings Filter Through
The FTSE labored in early European trade before gaining momentum to recover some of the losses from the past two days, posting session highs of 7135. The improved sentiment was somewhat stifled due to China's slowing economic growth in the second quarter. On the domestic front matters were not helped by the ongoing political battle coupled with the rising cost of living and flight delays affecting the UK summer. Workers at Network Rail and 14 train operators announced they intend to walk out for a further two days in August following an unresolved pay dispute and conditions, the RMT union said. This follows the largest rail strike in decades in June.
Among notable movers on the day Burberrystock fell 7.2% after the British fashion brand announced a drop in sales in China, a key market, of 35% in the first quarter.Rio Tinto PLCwas the second biggest faller this morning, down 2.6%. The listed miner noted that copper, aluminum and iron prices were declining while the economic outlook weakens.
Introduction to Technical Analysis
Technical Analysis Chart Patterns
Recommended by Zain Vawda
FTSE 100 Daily Chart - July15, 2022
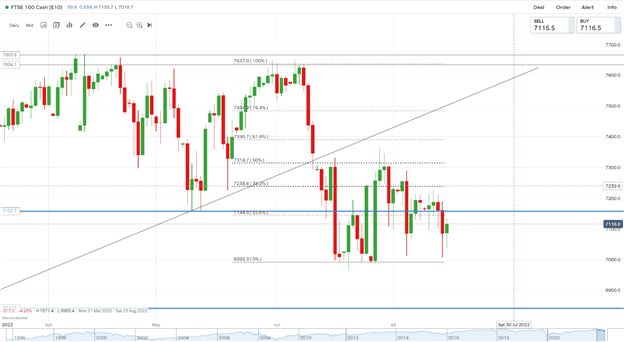
Source:IG
The FTSE closed last week as a hanging man candlestick signaling last week’s upside move may be short lived, with indecision the order of the day. Yesterday saw us reinforce that notion with continued rangebound price action as we retested lows and our psychological 7000 level before bouncing. The rangebound opportunities remain without a clean break of either the 50% or 0% fib levels.
Trading Ranges with Fibonacci Retracements
Key intraday levels that are worth watching:
Support Areas
- 7012
- 6870
Resistance Areas
- 7144
- 7214
Introduction to Technical Analysis
Candlestick Patterns
Recommended by Zain Vawda
DOW JONES:Cautiously Higher as Bank Earnings Continue
The Dow edged up in premarket trade continuing its recovery at the end of a week in which markets have been whipsawed by shifting expectations for monetary tightening by the Federal Reserve and worries over global economic growth. Investors are weighing up how hawkish the Fed must be to curb inflation and the likely toll on the economy. Bets on a one-percentage-point July rate hike have been scaled back after the latest commentary pointed toward 75 basis points. Federal Reserve Governor Chris Waller said he was open to raising interest rates by a full percentage point if the data – and next week’s housing numbers – come out stronger than expected, but otherwise, both he and the similarly hawkish James Bullard are in favor of sticking with a 75 basis point hike at the Fed’s meeting at the end of the month. Retail Sales in the US rose by 1% on a monthly basis to $680.6 billion in June, the data published by the US Census Bureau showed on Friday. This print followed May's contraction of 0.1% (revised from -0.3%) and surpassed the market expectation for an increase of 0.8%.
Earnings season kicked off yesterday with disappointing results from JPMorgan Chase & Co. and Morgan Stanley while Wells Fargo & Co. declined in premarket trading today after missing analysts’ second-quarter profit estimates. Meanwhile, about $1.9 trillion of options are set to expire Friday, an event that could bring some volatility to markets. Investors are also awaiting the next batch of US bank profit reports as the earnings season intensifies.
On the Calendar front we do have Michigan Consumer Expectations and Business Inventories out later in the day.

Customize and filter live economic data via our DailyFX economic calendar
DOW JONES Daily Chart – July 15,2022
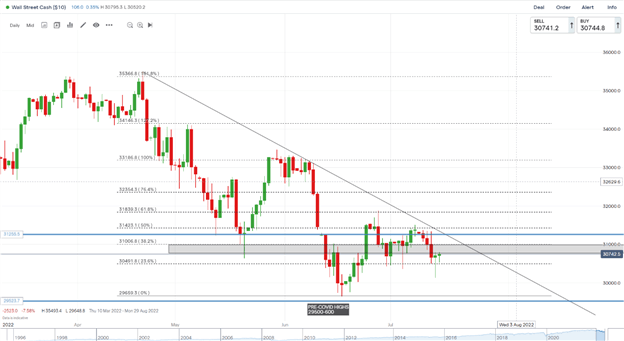
Source: IG
From a technical perspective, yesterday saw price push below the 23.6% fib level before a sharp bounce of support area 30080 resulted in a daily candle close back above the fib level. We have also closed as a hammer candlestick on the daily timeframe indicating potential upside.
We currently have resistance in the form of the grey box and trendline above current price and would need a clean break and daily candle close above to confirm the end of the range. A rejection of the trendline and 50% fib level could lead us back down, continuing the rangebound nature of recent weeks. Flexibility is needed in current market conditions.
Key intraday levels that are worth watching:
Support Areas
- 30080
- 29600
Resistance Areas
- 31006
- 31420
| Change in | Longs | Shorts | OI |
| Daily | -18% | 18% | 7% |
| Weekly | -19% | 14% | 4% |
Written by: Zain Vawda, Market Writer for DailyFX.com
Contact and follow Zain on Twitter: @zvawda


