


Gold Price (XAU/USD), Chart, and Analysis
- Gold may test multi-week lows.
- The Fed chair’s semi-annual congressional testimony is imminent.

For all market-moving data releases and events, see the DailyFX Economic Calendar.
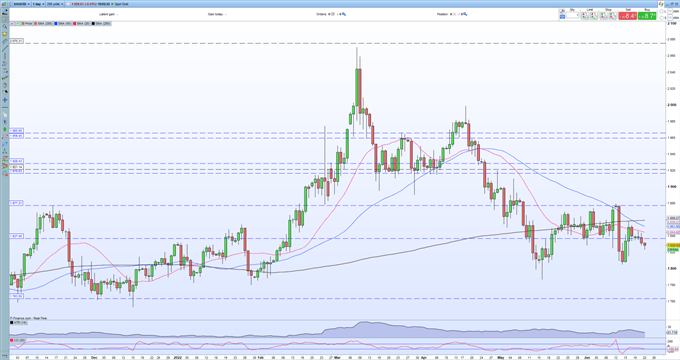
Gold is making a short-term series of lower highs on the daily chart which may suggest the $1,805/oz. to $1,815/oz. zone of near-term support may come under threat. All bets may be off however if Fed chair Jerome Powell tempers any extreme hawkish rhetoric in his upcoming meetings with Congress. Chair Powell testifies to the Senate Banking Committee today (13:30 GMT) before speaking to the House Financial Services Committee on Thursday (14:00 GMT). Chair Powell has already opined that the central bank should hike interest rates by a further 50 or 75 bps at the next FOMC meeting in late July, and the market is currently pricing 71 basis points of rate hikes at this meeting. As always with these big economic events, it is wise to let the dust settle before making a trading decision.
The daily gold chart shows gold trapped in two trading areas. The larger zone is between $1,805/oz. and $1,877/oz. while last Thursday’s $1,815/oz. to $1,858/oz. candle is currently holding short-term price action. The precious metal is below all three simple moving averages, a negative set-up, while last Friday’s ‘death cross’ – 50-day sma below the 200-day sma – also highlights how price action has turned further bearish.
A Comprehensive Guide to Moving Averages
Gold Daily Price Chart – June 22, 2022
Trade Smarter - Sign up for the DailyFX Newsletter
Receive timely and compelling market commentary from the DailyFX team
Retail trader data show 81.63% of traders are net-long with the ratio of traders long to short at 4.44 to 1. The number of traders net-long is 0.54% lower than yesterday and 7.48% lower from last week, while the number of traders net-short is 1.49% higher than yesterday and 33.15% higher from last week.
We typically take a contrarian view to crowd sentiment, and the fact traders are net-long suggests Gold prices may continue to fall. Yet traders are less net-long than yesterday and compared with last week. Recent changes in sentiment warn that the current Gold price trend may soon reverse higher despite the fact traders remain net-long.
| Change in | Longs | Shorts | OI |
| Daily | 1% | -3% | -1% |
| Weekly | 2% | -8% | -2% |
What are your views on Gold – bullish or bearish?? You can let us know via the form at the end of this piece or you can contact the author via Twitter @nickcawley1.


