DOW JONES, HANG SENG INDEX, ASX 200 INDEX OUTLOOK:
- Dow Jones, S&P 500 and Nasdaq 100 indexes closed -1.76%, -1.55% and -1.63% respectively
- Western powers unveil sanctions on Russia, including banning seven banks from the SWIFT payment system
- Asia-Pacific equities opened lower. Investors will be eyeing Powell’s congressional speech for more clues


S&P 500, Ukraine, Crude Oil, Asia-Pacific at Open:
The S&P 500 index fell 1.55% on Wednesday as heightened geopolitical tensions in Eastern Europe weighed on market sentiment. The fight in the capital city of Kyiv continued for a sixth day, with the Russian military shelling cities around the clock. Russian defense minister Sergei Shoigu said that the country will continue its military operation in Ukraine until it achieves its goals.
Western powers retaliated with stringent economic sanctions on Russian financial institutions and the central bank. EU ambassadors agreed to exclude seven Russian banks from the SWIFT payments network, which is crucial to the country’s settlement of trade in crude oil, natural gas and other commodities. There are growing calls from US lawmakers to cut off US imports of Russian oil, which will add supply constraints in an already tight market.
Market participants are vigilant about a potential further escalation of the Ukraine situation that may result in direct sanctions on Russia’s energy exports– a major revenue source for Kremlin. As a result, WTI crude oil prices soared 10% overnight to $106 bbl, marking its largest single day gain since April 2020.
Surging crude oil prices may weigh on economic recoveries as the cost for energy and raw material rises. This may hurt Asia’s major oil importing country such as China, Japan and India. The resulting higher inflation will likely urge central banks around the globe to take a more aggressive approach to tighten monetary policy. At this very moment, however, the Ukraine war has created a large amount of geopolitical uncertainty that may hinder the Fed’s roadmap for tightening. This puts Fed Chair Jerome Powell’s congressional speech later today in the spotlight.
Crude Oil Price - Daily
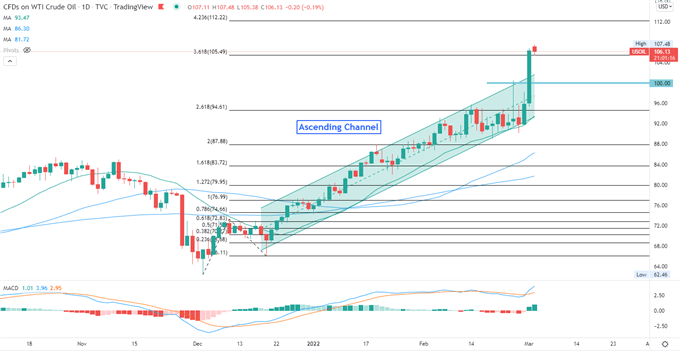
Chart created with TradingView
Asia-Pacific markets look set to trade lower following a sour lead on Wall Street. Futures in Japan, Australia, Hong Kong, Taiwan, Singapore and India are in the red, whereas those in mainland China, South Korea, Malaysia, Thailand and Indonesia are in the green.
Looking ahead, German jobs report index dominates the economic docket alongside and Euro area core inflation rate and Bank of Canada interest rate decision. Find out more from the DailyFX economic calendar.
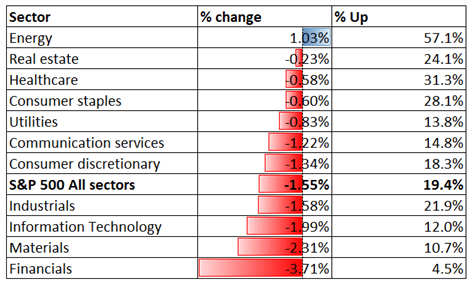
Looking back to Tuesday’s close, 10 out of 11 S&P 500 sectors ended lower, with 80.6% of the index’s constituents closing in the red. Financials (-3.71%), materials (-2.31%) and information technology (-1.99%) were among the worst performers, whereas energy (+1.03%) registered a small gain.
Dow Jones Sector Performance 01-03-2021
Source: Bloomberg, DailyFX
S&P 500 Index Technical Analysis
The S&P 500 index may have entered a meaningful correction after breaching below an “Ascending Channel” as highlighted on the chart below. Prices extended lower after the formation of a “Double Top” chart pattern, which is commonly viewed as a bearish trend-reversal indicator. Prices rebounded sharply from a key support level of 4,200, but the overall trend remains bearish-biased. The MACD indicator is about to form a bullish crossover beneath the neutral midpoint, suggesting that near-term selling pressure may be fading.
S&P 500Index – Daily Chart
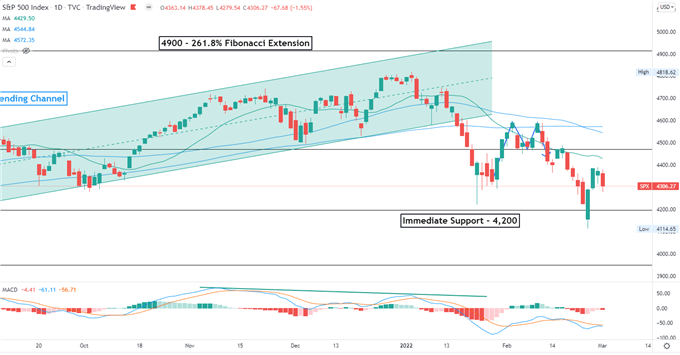
Chart created with TradingView
Hang Seng Index Technical Analysis:
The Hang Seng Index (HSI) breached below an “Ascending Channel” as highlighted on the chart below, suggesting that near-term trend has turned bearish. Prices are testing an immediate support level of 22,800 – the previous low seen in the end of December and early January. Holding above this level may pave the way for a technical rebound. The MACD indicator formed a bearish crossover and trended lower, underscoring bearish momentum.
Hang Seng Index – Daily Chart
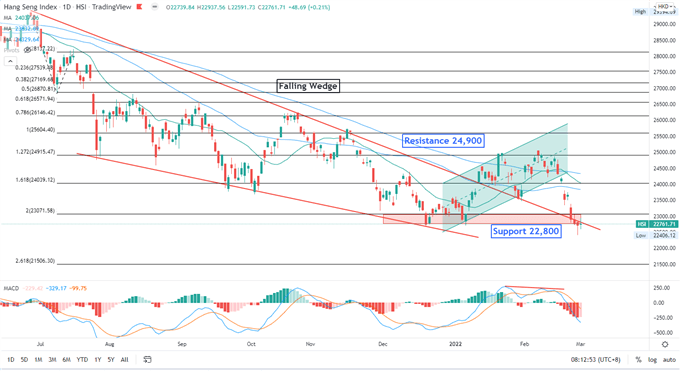
Chart created with TradingView
ASX 200 Index Technical Analysis:
The ASX 200 index formed a “Double Top” chart pattern and has since entered a technical correction. An immediate support level can be found at 6,960 – the 23.6% Fibonacci retracement. Breaching below this level may intensify near-term selling pressure and expose the next support level of 6,758. A key resistance level can be found at 9,290, the previous high.
ASX 200 Index – Daily Chart
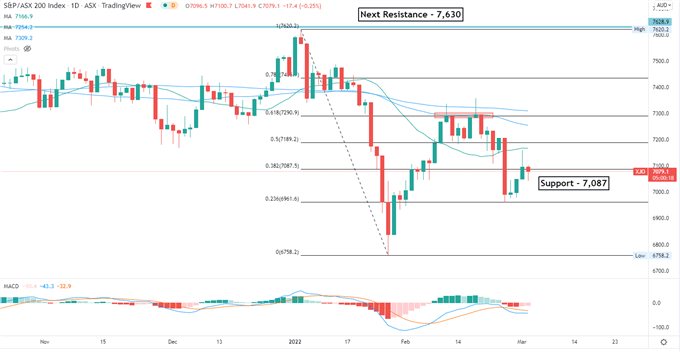
Chart created with TradingView


--- Written by Margaret Yang, Strategist for DailyFX.com
To contact Margaret, use the Comments section below or @margaretyjy on Twitter


