


Bitcoin (BTC) Chart and Analysis
- Bitcoin continues to crab sideways.
- Volatility remains low despite a ‘death-cross’ formation.

For a product famed for its wild price swings and double-digit percentage moves, Bitcoin is currently experiencing a lull in price action with volatility currently sitting at a multi-month low. Using the Average True Range (ATR) indicator, Bitcoin volatilities is at its lowest level since July 2021. This also coincided with the start of a strong Bitcoin rally with the crypto doubling over the next four months to hit a peak of just below $69k. This looks unlikely at this time with the simple moving averages in a bearish set-up compared to last July.
How to Measure Volatility with Average True Range (ATR)
The 50- and 200-day simple moving averages have also crossed over forming a bearish ‘death-cross’ formation. The last time these two simple moving averages crossed was back in mid-September when a bullish ‘golden-cross’ was formed. The price of Bitcoin moved lower in the next couple of weeks before rallying hard.
Bitcoin Daily Price Chart January 20, 2022
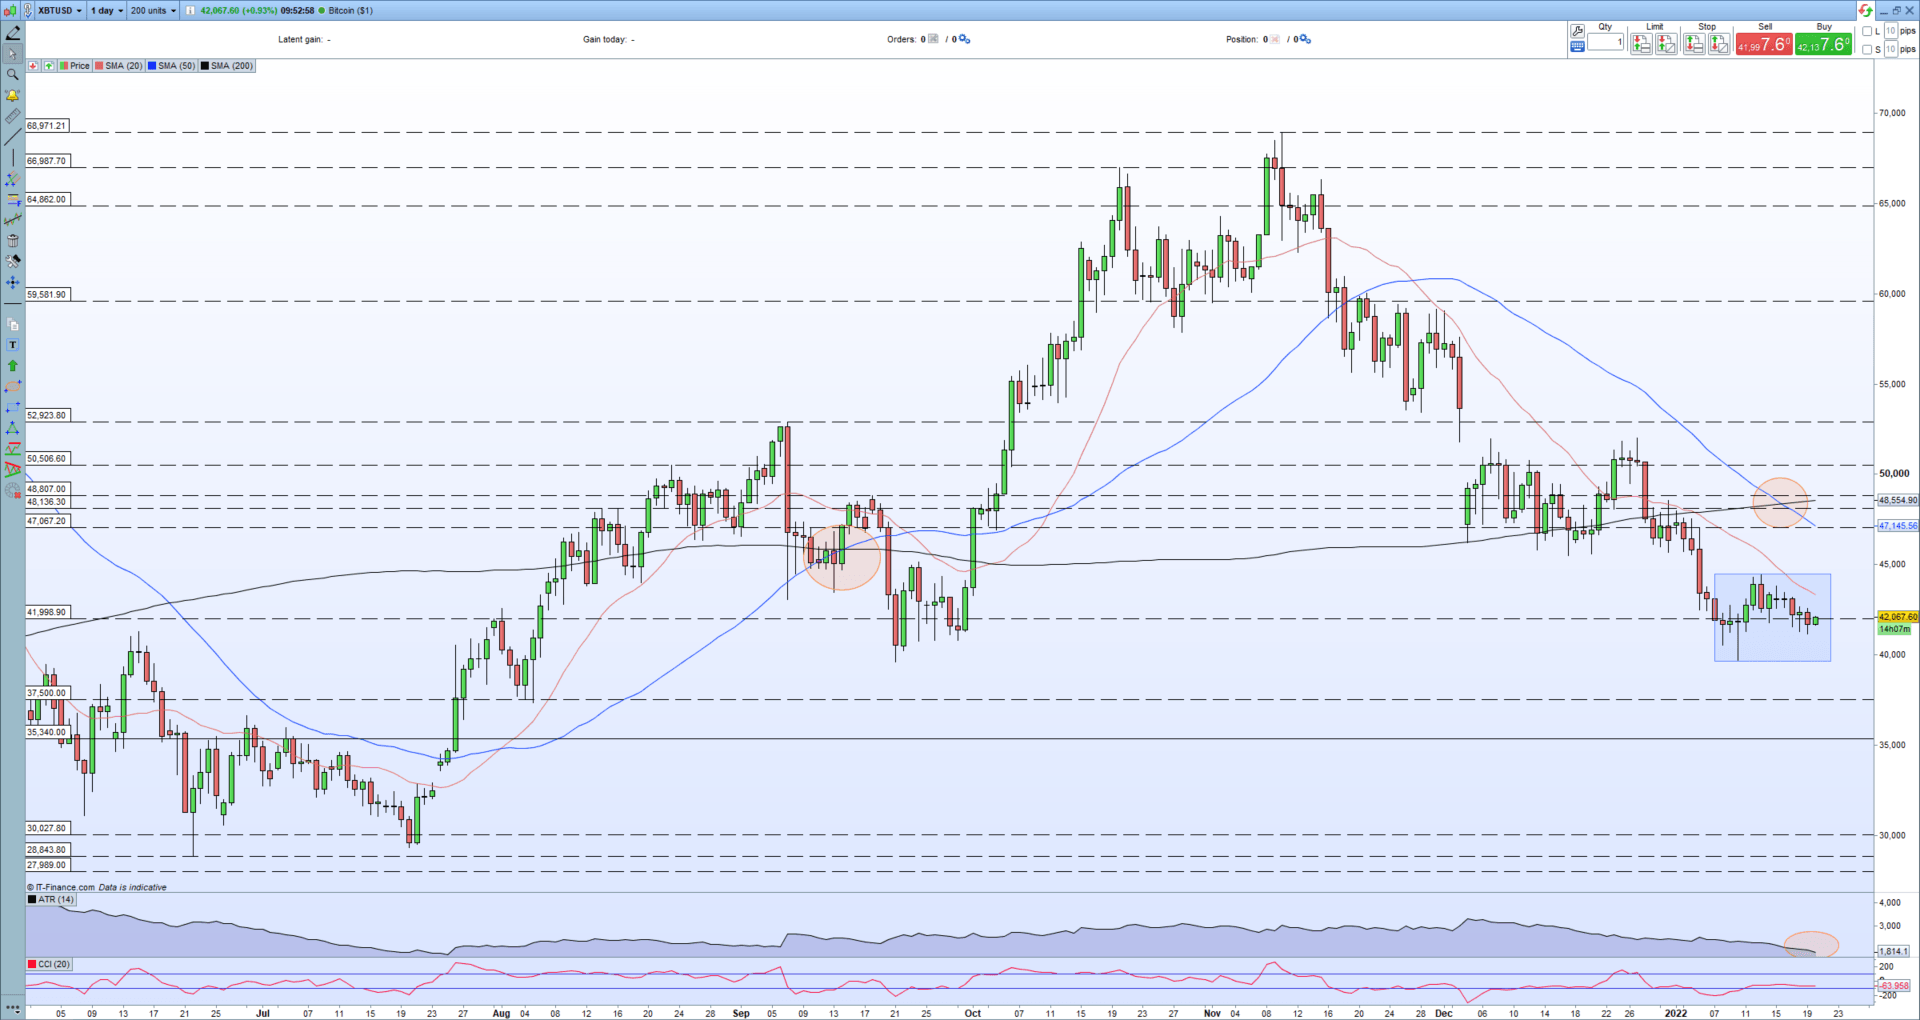
Chart via Pro Realtime
Bitcoin currently trades in a tight range and may continue trading sideways until next week’s Fed decision is out of the way. Bitcoin has become more of a risk-proxy of late, moving higher when the market turns risk-on and lower when the market turns risk-off. Next week’s Fed rate decision will be the next risk event and will help shape the short-term direction of BTC. Financial markets are currently pricing in an uber hawkish Federal Reserve with this environment pushing equity markets ever lower. The Russell 2000 index, a small-cap US equity market proxy, is down over 16% since early November and currently trades at levels last seen one year ago. It remains to be seen if the Fed will turn out to be as hawkish as markets are currently pricing-in, leaving the door open for a risk-on move to push markets higher if the Fed disappoints market hawks.
Russell 2000 ETF Daily Price Chart January 20, 2022

Chart via TradingView
What is your view on Bitcoin – bullish or bearish?? You can let us know via the form at the end of this piece or you can contact the author via Twitter @nickcawley1.


