


RAND ANALYSIS
- Rand outshines EM peers.
- NFP in focus.
- USD/ZAR finds resistance at 16.00, bullish flag pattern persists.
ZAR FUNDAMENTAL BACKDROP
Yesterday’s U.S. ISM Non-Manufacturing PMI miss for the December period pushed the South African rand higher against the U.S. dollar. Continuation of this strength is seen in early trading on Friday despite an amplified hawkish tilt from the FOMC minutes earlier this week.
Emerging Market (EM) currencies are broadly up in line with the ZAR move but the outlook remains skewed to the dollar irrespective of an NFP miss later today. The rand is the second best performing currency year-to-date against the dollar (see graphic below) but dollar forecasts point to an uphill battle for the rand.
YTD CURRENCY PERFORMANCE VS USD (2022)
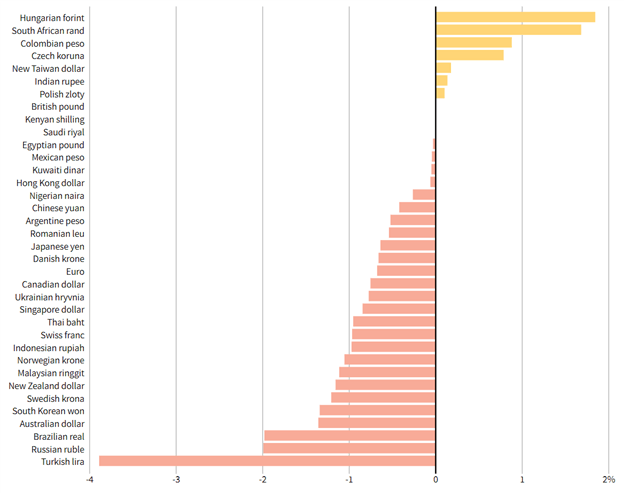
Source: Reuters
Elevated coal, platinum and iron ore price give the commodity linked rand some support and could hold off minor headwinds from the greenback.
UPCOMING ECONOMIC DATA
As mentioned before, NFP data is the highlight of the week and could bring about material change for USD/ZAR. If the earlier ADP print is anything to go by, we could see a significant beat on the estimated 400K figure and consequently a push higher on the pair.
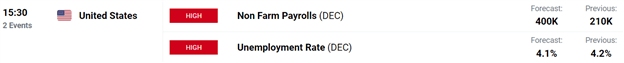
Source: DailyFX economic calendar

TECHNICAL ANALYSIS
USD/ZAR DAILY CHART
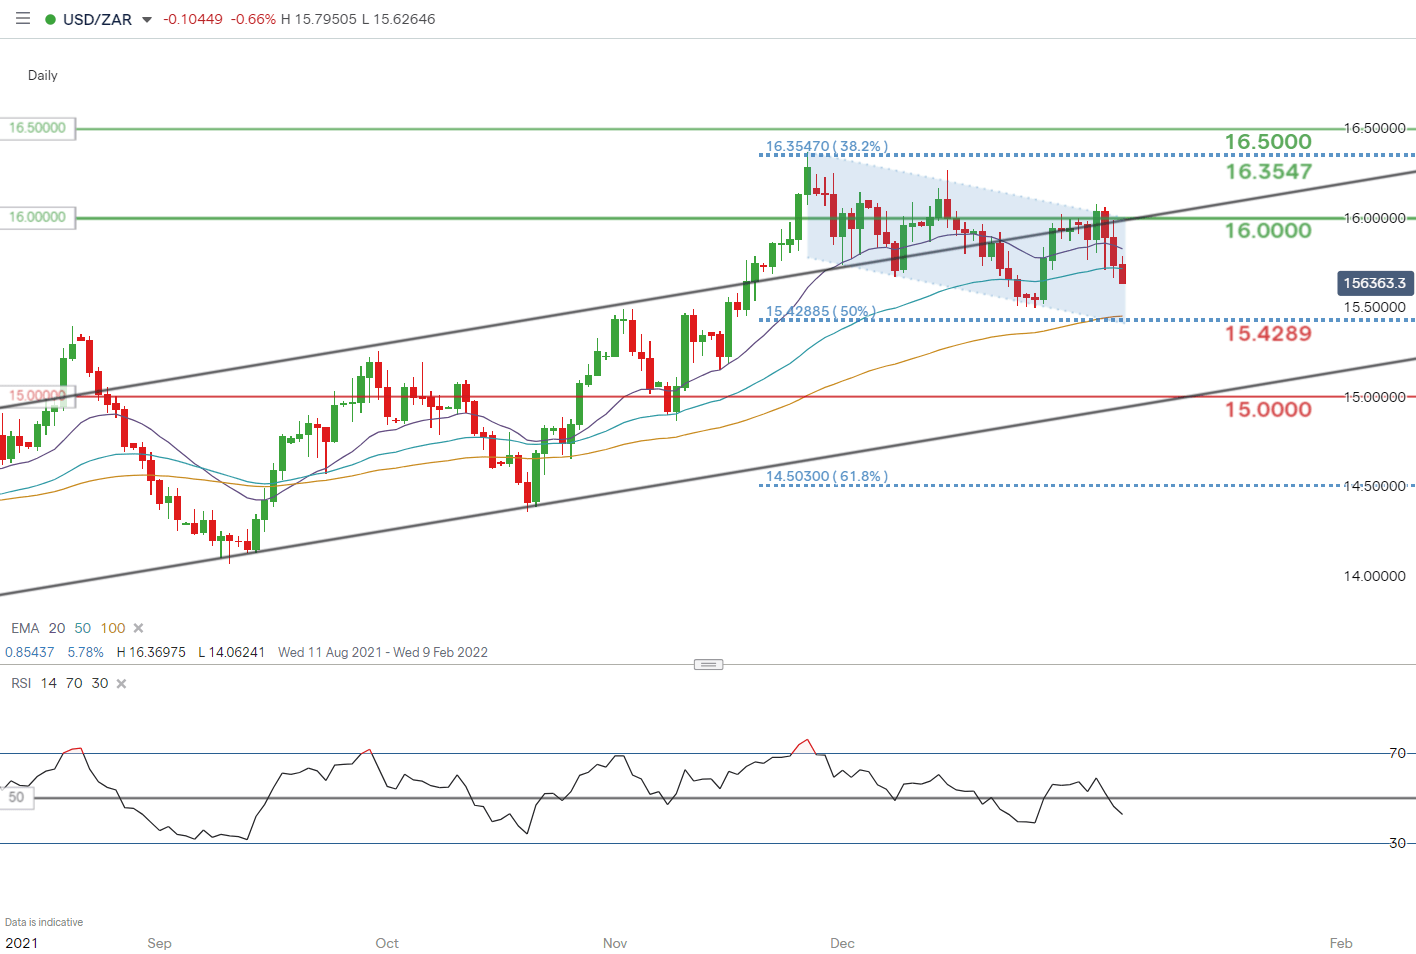
Chart prepared by Warren Venketas, IG
The first trading week of 2022 has been encouraging for the rand, finding resistance around the 16.0000 psychological level (coinciding with flag resistance) while pushing below two short term EMA support targets. The short-term bull flag pattern (blue) remains with both upside and downside potential on the cards ahead of NFPs.
Resistance Levels:
- 16.3547 – 38.2% Fibonacci level
- 16.0000
Support Levels:
- 15.4289 – 50% Fibonacci level
Trade Smarter - Sign up for the DailyFX Newsletter
Receive timely and compelling market commentary from the DailyFX team
Contact and follow Warren on Twitter: @WVenketas


