


Gold Price Forecast:
- Gold prices reach a one-month high as inflation pressures support demand for the safe-haven asset
- US Dollar and rising equities hold Gold bulls at bay
- Technical levels hold firm as prices test resistance

Visit the DailyFX Educational Center to discover why news events are Key to Forex Fundamental Analysis
Gold prices have recently reached a one-month high after the number of worldwide Covid cases reached a record high.
However, although rising inflation and geopolitical factors have supported the demand for the precious metal, the Santa Claus rally and a stronger Dollar has hindered further progression.

Gold (XAU/USD) Technical Analysis
Over the past three weeks, Gold bulls have managed to regain temporary control over the systemic, prominent trend in an effort to drive prices back towards the 38.2% Fibonacci retracement of the 2020 move at $1,835.
Although the downward trajectory from the August 2020 high currently remains intact, prices have risen above the 50-week moving average, currently providing support at the key psychological level of $1,800.
Gold (XAU/USD) Weekly Chart
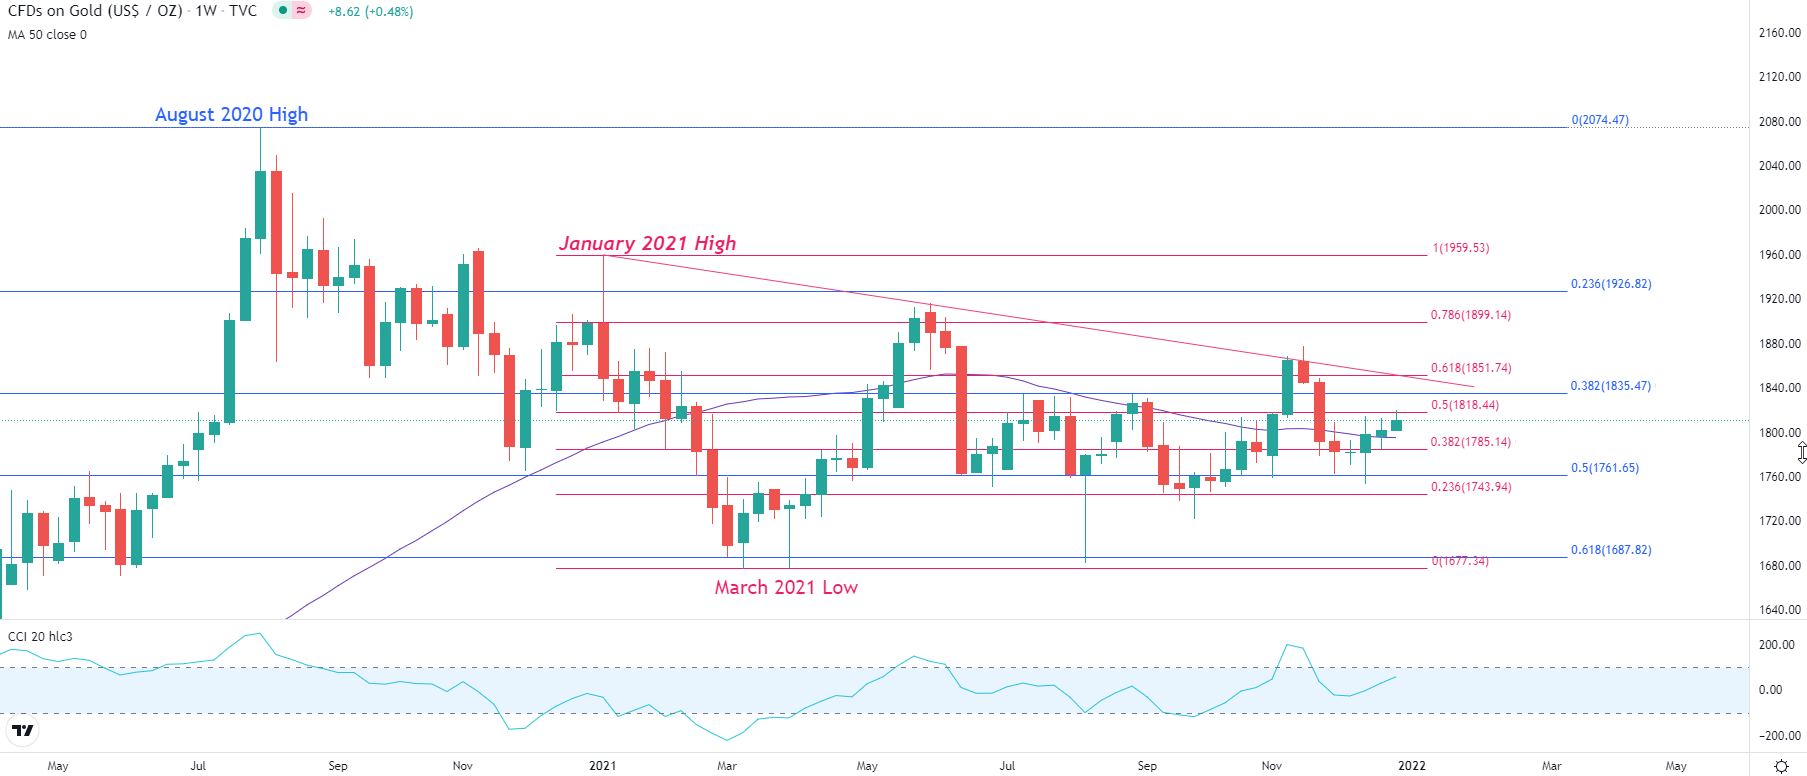
Chart prepared by Tammy Da Costa using TradingView
Meanwhile on the daily time-frame, price action has temporarily stalled at the 50% retracement level of the 2021 move which continues to provide resistance for the imminent move at $1,818.
As bulls and bears battle it out, the CCI (commodity channel index) has broken above the normal range, a potential indication that XAU/USD may be overbought.
Gold (XAU/USD) Daily Chart
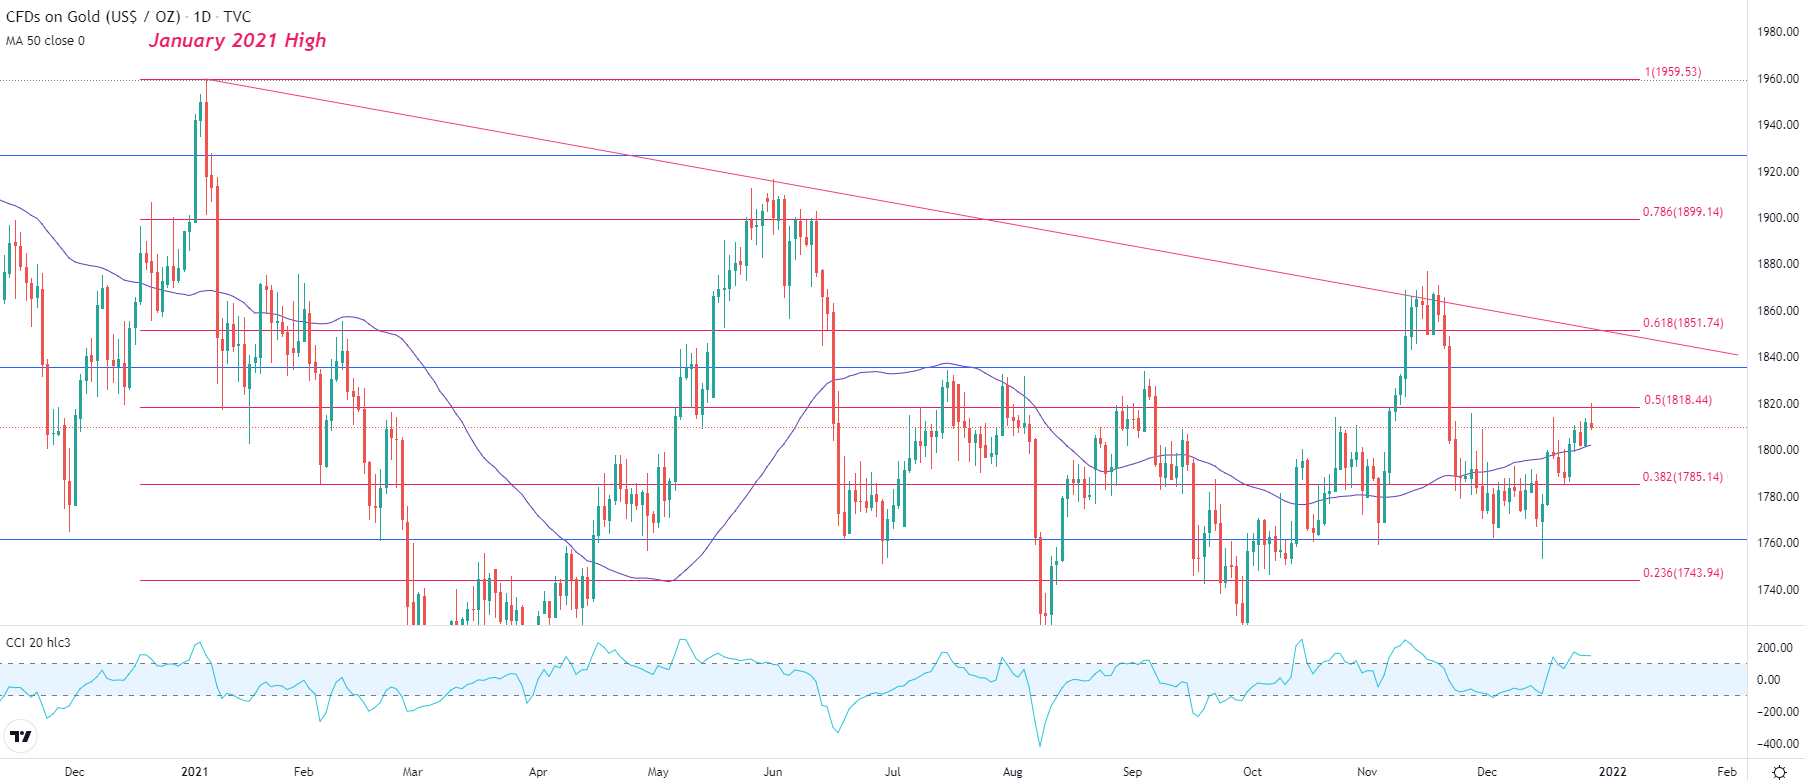
Chart prepared by Tammy Da Costa using TradingView
| Change in | Longs | Shorts | OI |
| Daily | 1% | -3% | -1% |
| Weekly | 2% | -8% | -2% |
--- Written by Tammy Da Costa, Analyst for DailyFX.com
Contact and follow Tammy on Twitter: @Tams707


