


US Dollar Price, Chart, and Analysis
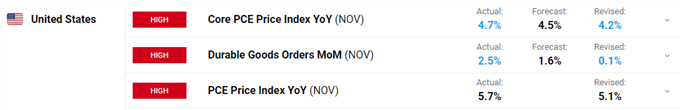
- Core PCE hits 4.7% in November, October revised 0.1% higher to 4.2%.
- US dollar ticks higher in holiday-thinned trading conditions.
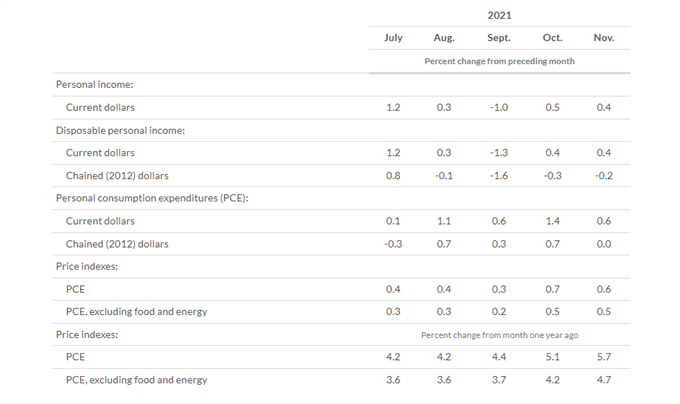
US core PCE - a measure of prices that people living in the US pay for goods and services excluding food and energy –hit 4.7% in November, compared to expectations of 4.5% and last month’s reading of an upwardly revised 4.2%. The PCE index for November increased by 5.7% from one year ago, ‘reflecting increases in both goods and services. Energy prices increased 34% while food prices increased 5.6%’, according to the US Department of Commerce.
US durable goods for November also beat market estimates, rising by 2.5% m/m compared to forecasts of 1.6%.
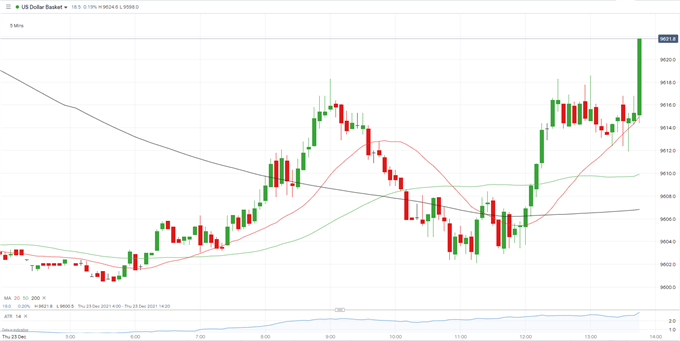
The US dollar nudged a few ticks higher post-release in thin trading conditions. The US dollar basket (DXY) is trading around 96.15, after respecting Wednesday’s low at 96.00. Both of today’s data releases should underpin the greenback and market expectations of multiple rate hikes over the next two years as the Fed tries to dampen runaway inflation.
US Dollar (DXY)Daily Price Chart December 23, 2021

What is your view on the US Dollar – bullish or bearish?? You can let us know via the form at the end of this piece or you can contact the author via Twitter @nickcawley1.


