


Gold Talking Points:
- Gold (XAU/USD) prices remain supported by inflation but USD strength limits gains
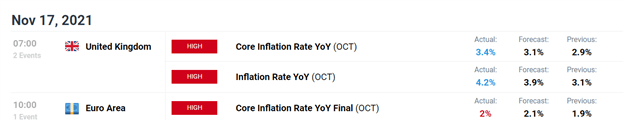
- UK inflation data climbs to 10 year high, pressure intensifies for BoE to raise rates
- Rising yields and a more hawkish Fed may continue to weigh on sentiment ahead of next week’s FOMC

UK CPI Rises to Decade High Boosting Demand for Gold
After last week’s US CPI print pushed Gold prices through trendline resistance, a more hawkish tone from the Federal reserve has lifted demand for yields which has supported USD strength, capping Bullion’s gains.
Find out more about the impact of interest rates on the foreign exchange market
Although the combination of higher inflation data and rising geopolitical tensions continue to weigh on risk sentiment, the release of higher than expected UK CPI print raises the probability of a December rate hike from the BoE (Bank of England).
DailyFX Economic Calendar
However, as inflationary pressures continue to loom, Gold and Silver are renowned for their ability to act as a hedge against inflation which may continue to support prices for the imminent move.

Gold Price Analysis:
As talks of inflation remain at the forefront of risk sentiment, a break above trendline resistance on the weekly time-frame has lifted gold prices above the 61.8% Fibonacci retracement level of the 2021 move at $1,851, currently holding at support.
Gold Weekly Chart

Chart prepared by Tammy Da Costa using TradingView
As price action continues to test the above mentioned level of support, the CCI (commodity channel index) is currently testing overbought territory on both the weekly and daily time-frame, a potential indication that the upside prevails, at least for now.
Gold Daily Chart
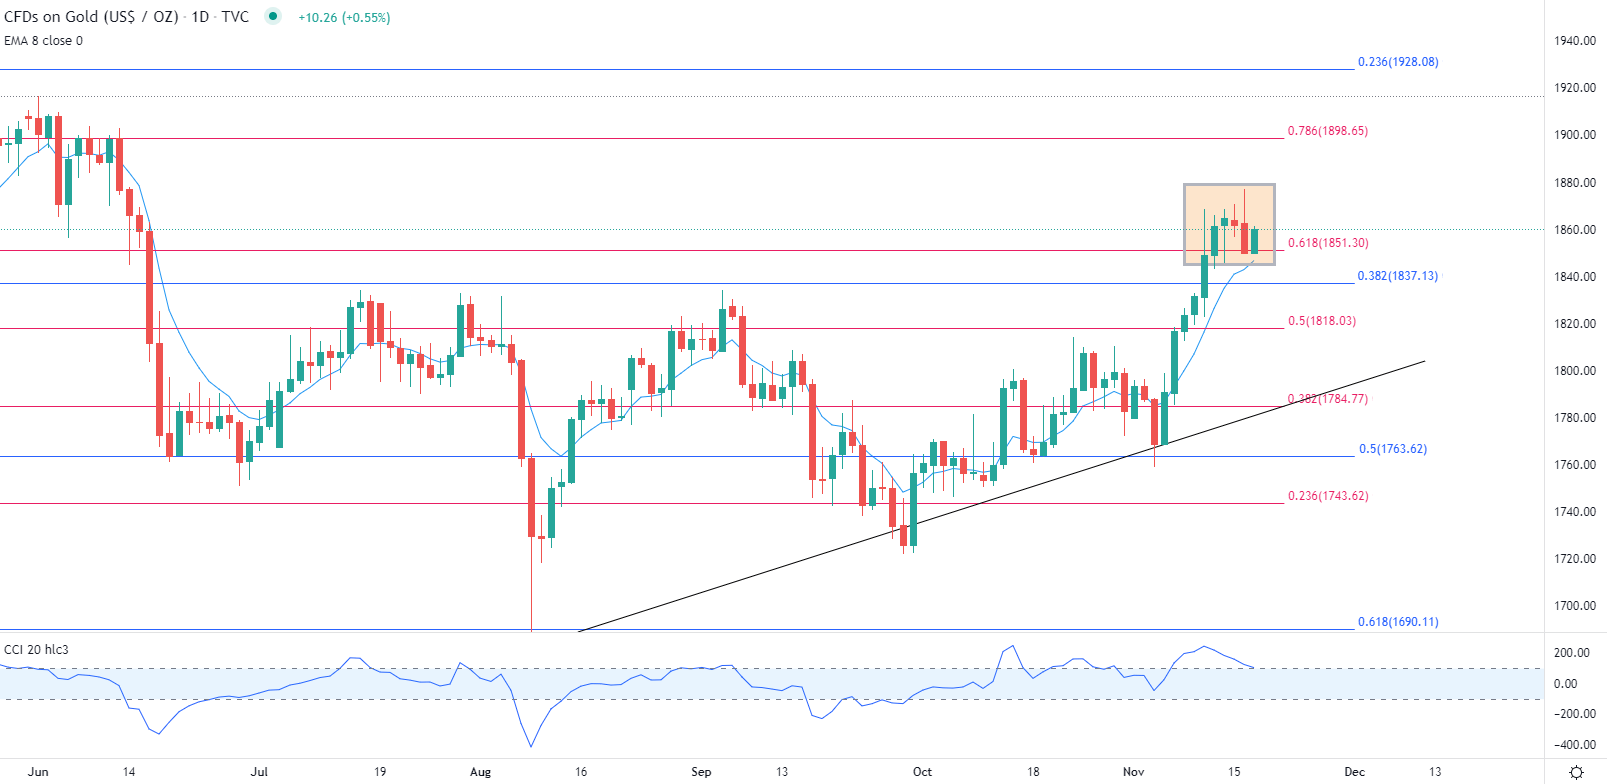
Chart prepared by Tammy Da Costa using TradingView
| Change in | Longs | Shorts | OI |
| Daily | 1% | -3% | -1% |
| Weekly | 2% | -8% | -2% |
Gold Key Levels
Support Levels - $1,851; $1,840; $1,820
Resistance Levels - $1,860; $1,880; $1,900
--- Written by Tammy Da Costa, Analyst for DailyFX.com
Contact and follow Tammy on Twitter: @Tams707


